
Figure 1.
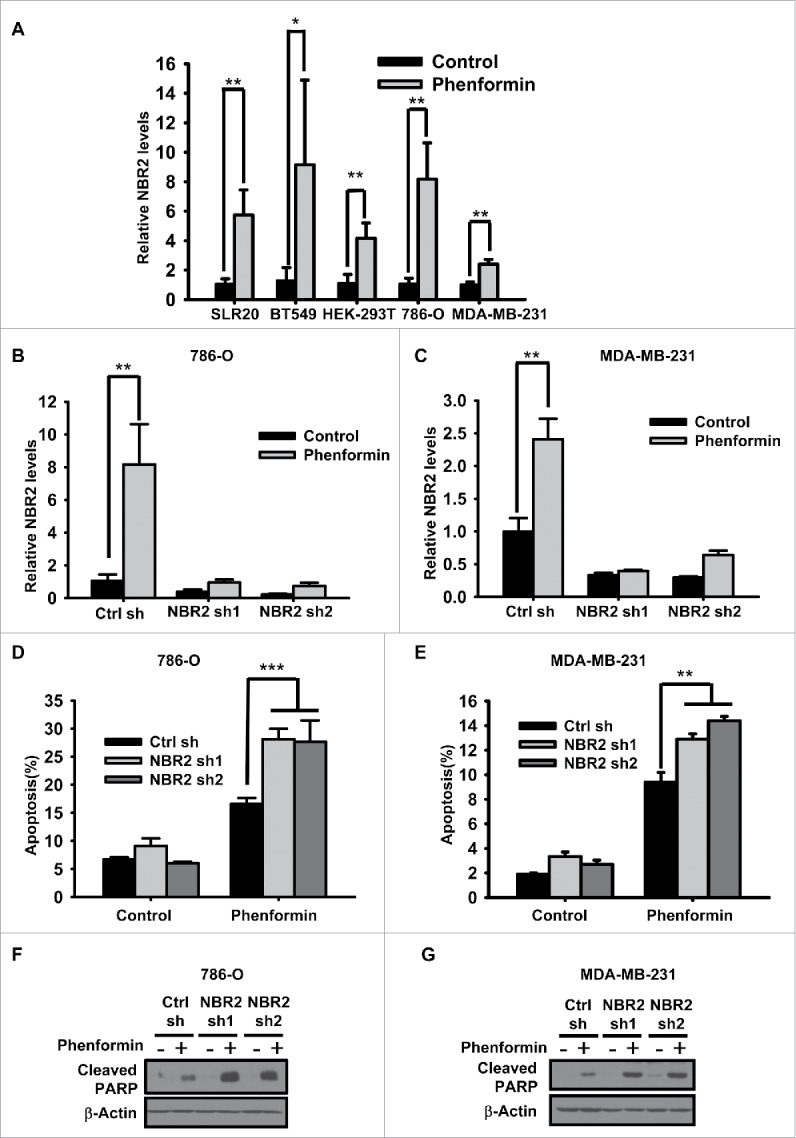
Phenformin induces NBR2 expression and NBR2 deficiency renders cancer cells more sensitive to phenformin-induced cell death. (A) Various cell lines were treated with 0 or 2mM phenformin for 18–24 hours, and then subjected to real-time PCR analysis to measure NBR2 expression. Three independent experiments were performed and the values were expressed as the mean ± SD, *: P< 0.05, **: P < 0.01. (B and C) Bar graph showing NBR2 shRNA-mediated knockdown efficiency by real-time PCR analysis under basal and phenformin treatment in 786-O (B) and MDA-MB-231 cells (C). Three independent experiments were performed and the values were expressed as the mean ± SD, **: P < 0.01. (D and E) Control shRNA or NBR2 shRNA-infected 786O cells (D) or MDA-MB-231 cells (E) were treated with 0 or 2 mM phenformin for 18 hours, then subjected to Annexin V/PI staining followed by FACS analysis to measure the percentages of Annexin V positive/PI negative cells. Three independent experiments were performed and the values were expressed as the mean ± SD, **: P < 0.01, ***: P < 0.001. (F and G) Control shRNA or NBR2 shRNA-infected 786O cells (F) or MDA-MB-231 cells (G) were treated with 0 or 2 mM phenformin for 18 hours. Cell lysates were then analyzed by Western blotting to measure PARP cleavage.