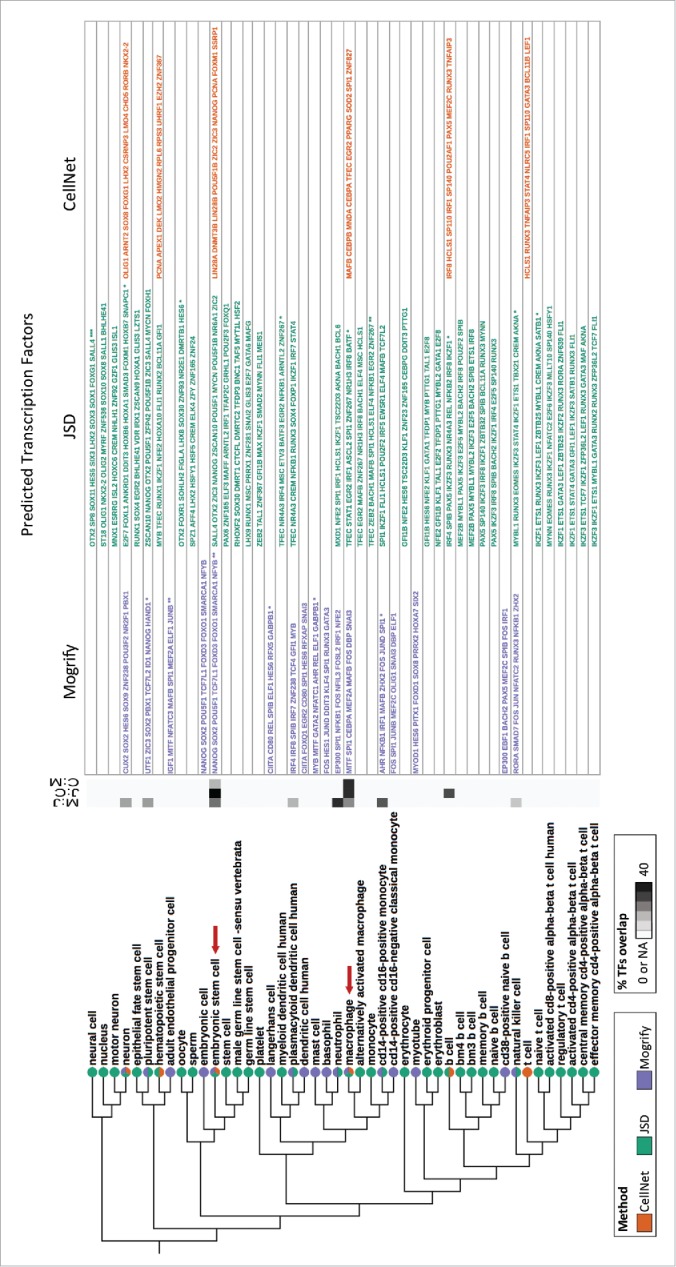
Figure 2.

Subset of cell-type ontology tree of transdifferentiation. Cell-types available for transdifferentiation from fibroblast by each method is mapped onto the UBERON cell-type ontology tree. The pie charts indicate which of the methods provide a prediction for the cell-type on the tree. The heatmap represents the overlap of the predicted TFs between methods (i.e. Mogrify and JSD is M:J, JSD and CellNet is J:C and CellNet and Mogrify is C:M). The table provides the set of TFs predicted by each method for conversion from fibroblast. If there are more than one predictions mapped to the cell-type node, then it is denoted by * and the number of asterisks indicates the number of addition.
