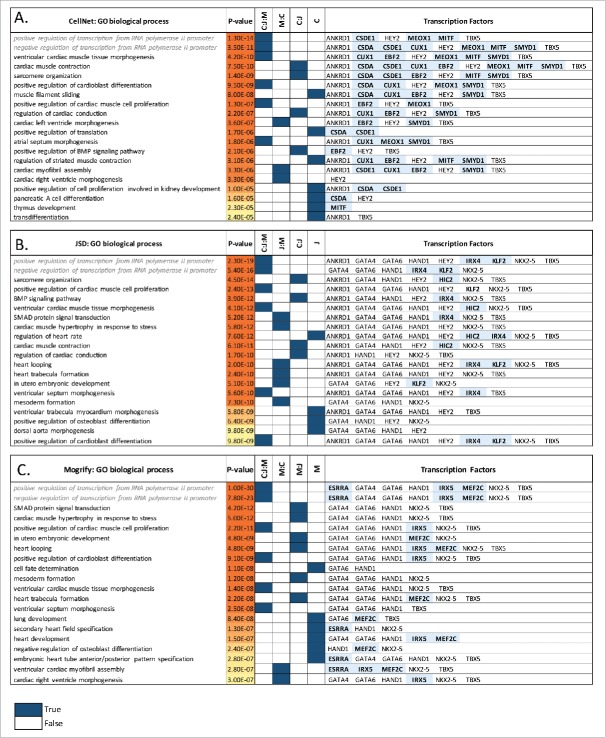
Figure 3.
Fibroblast to heart conversion. Top 20 gene ontology biological processes (BPs) enriched in the predicted TFs network for each method (A) CellNet, (B) JSD and (C) Mogrify are given with the corresponding p-values. The method Mogrify is denoted as M, CellNet is denoted as C, and JSD is denoted as J. The common BP enriched between the methods for example CellNet, JSD and Mogrify is represented as C:J:M; and between Mogrify and CellNet is represented as M:C. The last column provides the TFs that enriches the same BP when individual TF along with the first neighbors in the network were used. The unique TFs predicted by each method are highlighted. BP terms related to regulation of transcription are written in gray and italics.

