Figure 7.

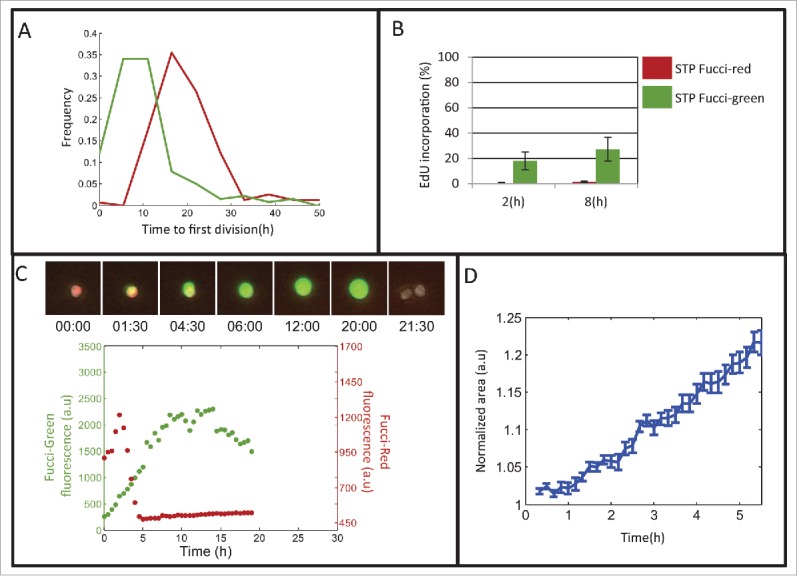
Characterization of the persistent subpopulation reveals a non-quiescent state. (A) Distribution of the time to first division of Fucci-red and Fucci-green subpopulations. The Kolmogorov-Smirnov test shows significant difference between the STP duration distributions (time till first division), p < 9e-028. (B) EdU incorporation of the Fucci subpopulations is measured over time. Mean of 2 replicates presented. Error bars: SE. (C) Representative Fucci traces of a STP Fucci-red cell in time-lapse microscopy. (D) Mean of the normalized area increase of STP Fucci-red cells (N = 112). Error bars represent SE.
