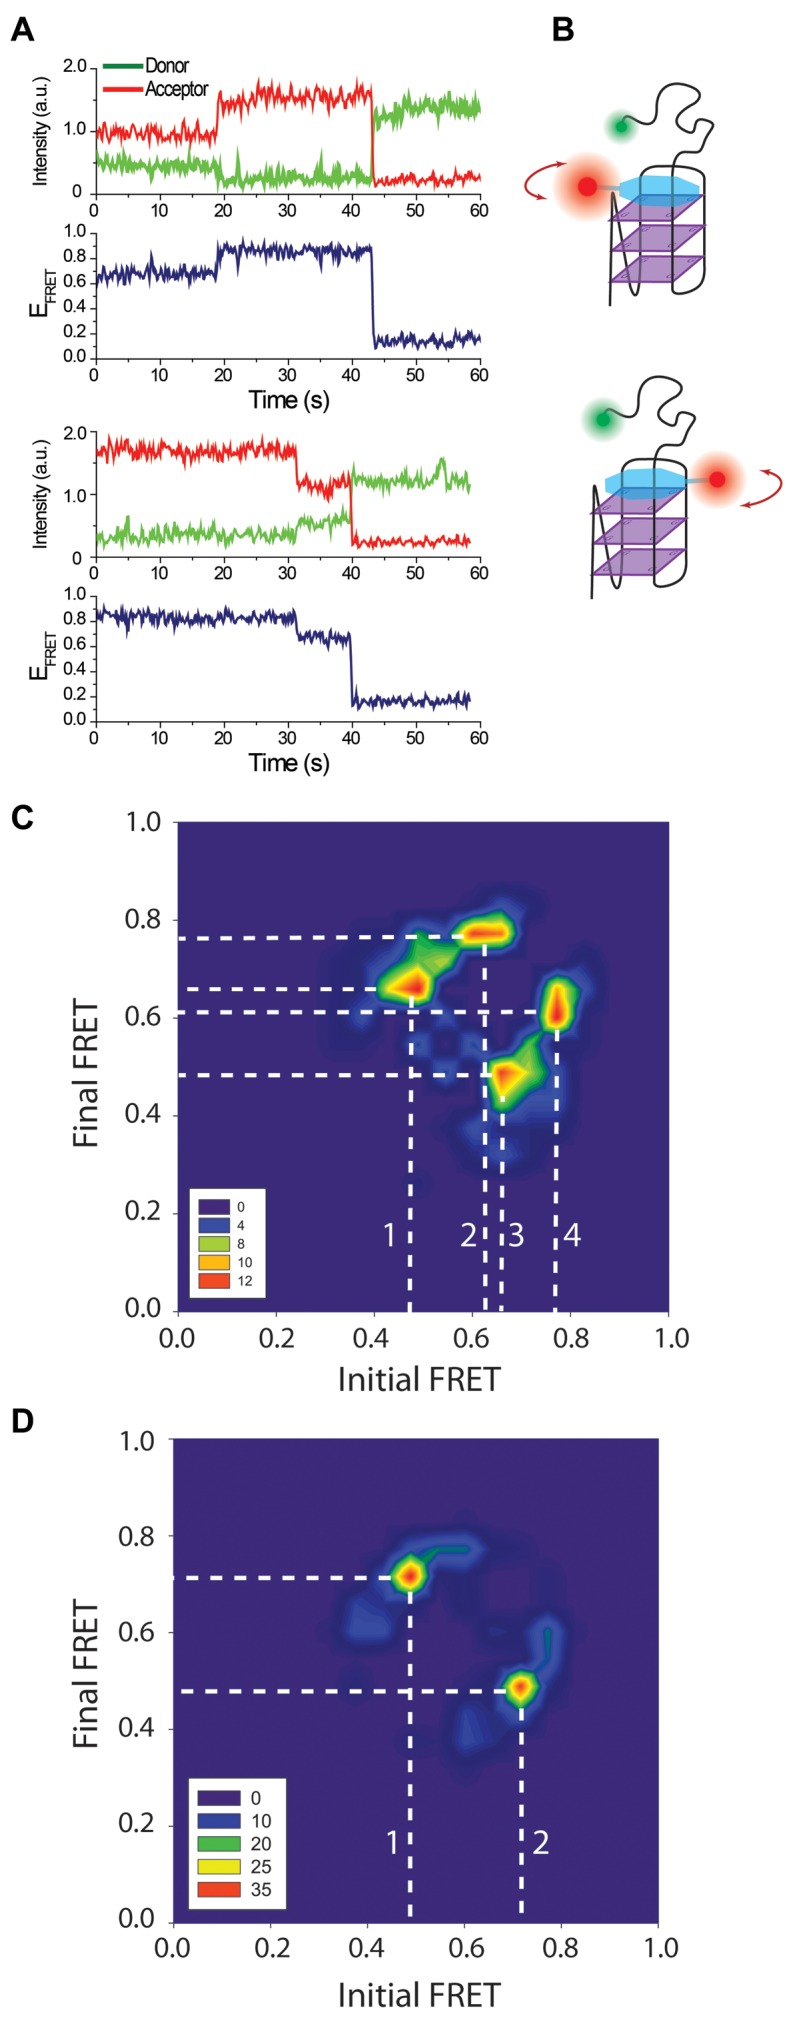
Figure 3.

(A) smFRET traces showing a transition from EF-Low to EF-High (top), and from EF-High to EF-Low (bottom). (B) A schematic of the model proposing different binding orientations for L1Cy5–7OTD, which we propose is the source of the observed FRET levels. (C) TDP constructed from pd-3Ly1Lp12T and pd-12T3Ly1Lp traces. Data were combined to accumulate enough statistics as the transitions are rare. (D) TDP constructed from pd-hGQ12T and pd-12ThGQ traces (data combined). The white dashed lines indicate the transitions between prominent FRET states. These transitions are marked with numbers to facilitate their identification. The TDP in both (C) and (D) are symmetric indicating that transitions from EF-High to EF-Low and vice versa are possible.
