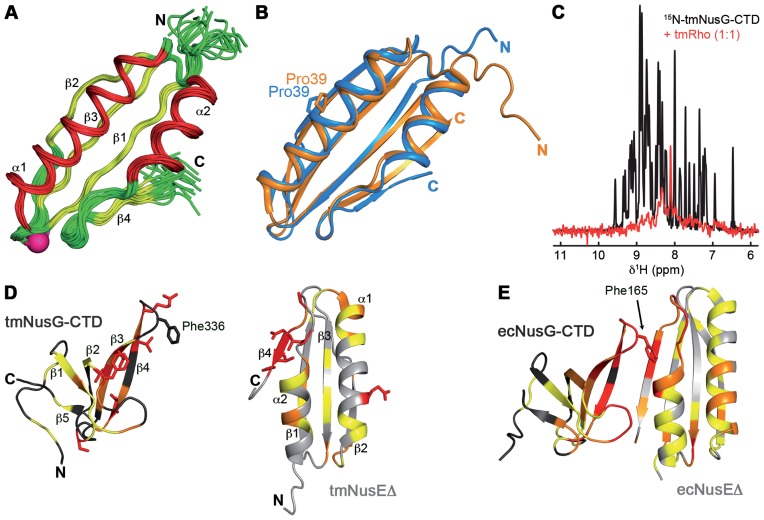
Figure 1.
tmNusEΔ and tmRho are interaction partners of tmNusG-CTD. (A) Solution structure of tmNusEΔ. Superposition of 20 accepted structures of tmNusEΔ in ribbon representation. α-helices, red; β-strands, yellow; loops, green. Secondary structure elements and termini are labeled. The Ser replacing the ribosome binding loop is shown as pink sphere. (B) Superposition of tmNusEΔ, blue and ecNusEΔ in the ecNusEΔ:ecNusB complex, orange (Protein Data Bank (PDB) ID: 3D3B). Selected amino acids are shown as sticks and labeled. (C) 1D [1H,15N]-HSQC spectra of 338 μM 15N-tmNusG-CTD, black, and of 27 μM 15N-tmNusG-CTD in the presence of tmRho in equimolar concentrations, red. (D) Interaction of tmNusEΔ with tmNusG-CTD. tmNusG-CTD (dark gray; PDB ID: 2LQ8) and tmNusEΔ (light gray) are in ribbon representation. Normalized chemical shift changes of the [1H,15N]-HSQC titrations of 15N-tmNusEΔ with tmNusG-CTD and 15N- tmNusG-CTD with tmNusEΔ are mapped on the structures. Δδnorm > 0.2 ppm, red; 0.2 ppm > Δδnorm > 0.1 ppm, orange; 0.1 ppm > Δδnorm > 0.04 ppm, yellow. Highly affected amino acids are in sticks representation. (E) Structure of the ecNusEΔ:ecNusG-CTD complex (PDB ID: 2KVQ). Representation as in (D). ecNusG-CTD, dark gray; ecNusEΔ, light gray. Normalized chemical shift changes of [1H,15N]-HSQC titrations are taken from Ref. (6).

