Figure 3.
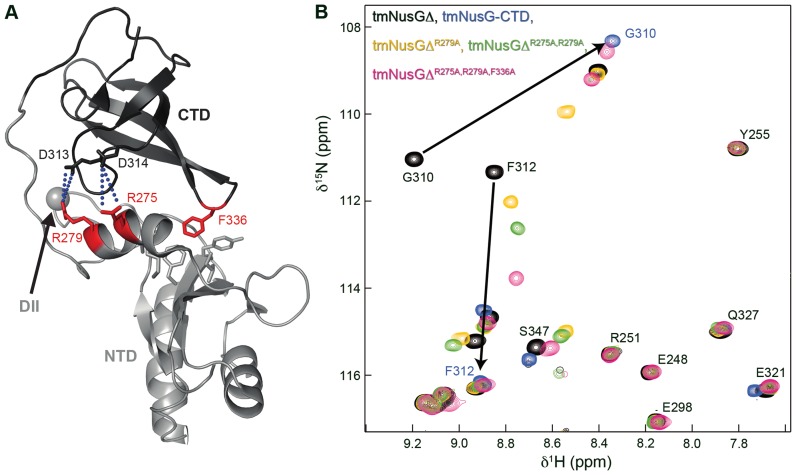
Determinants of the domain interactions in tmNusGΔ. (A) Cartoon representation of tmNusGΔ (PDB ID: 2LQ8). tmNusG-NTD, light gray; tmNusG-CTD, dark gray. Amino acids involved in domain interaction are shown as sticks with residues which were exchanged by alanines colored in red. The gray sphere marks the position where tmNusG-DII is integrated into tmNusG-NTD. Salt bridges are indicated by blue dots. (B) Section of the superposition of 2D [1H,15N]-HSQC spectra of 15N-tmNusGΔ (100 μM), black, 15N-tmNusG-CTD (150 μM), cyan, 15N-tmNusGΔR279A (100 μM), yellow, 15N-tmNusGΔR275A,R279A (100 μM), green and 15N-tmNusGΔR275A,R279A,F336A (420 μM), pink. Arrows indicate how tmNusG-CTD signals of tmNusGΔ shift toward the signals of isolated tmNusG-CTD upon successive amino acid exchanges.

