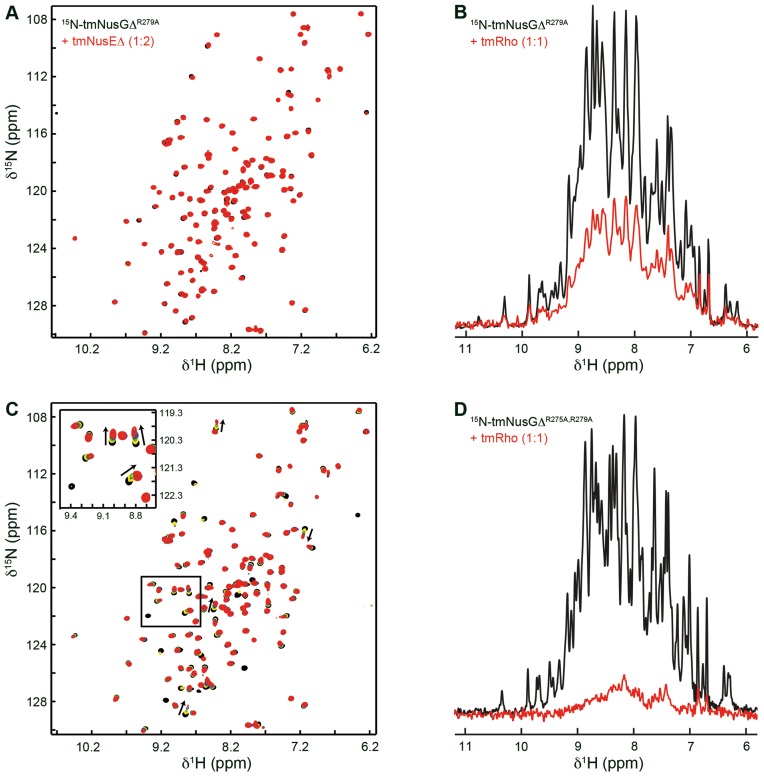
Figure 4.
Interaction of tmNusGΔ variants with tmNusEΔ and tmRho. (A) 2D [1H,15N]-HSQC spectra of 150 μM 15N-tmNusGΔR279A, black, and of 89 μM 15N-tmNusGΔR279A in the presence of tmNusEΔ in a 2-fold molar excess, red. (B) 1D [1H,15N]-HSQC spectra of 172 μM 15N-tmNusGΔR279A, black, and of 30 μM 15N-tmNusGΔR279A in the presence of tmRho in equimolar concentrations, red. (C) 2D [1H,15N]-HSQC spectra of the titration of 15N-tmNusGΔR275A,R279A with tmNusEΔ. tmNusEΔ (stock concentration: 438 μM) was added to 150 μM 15N-tmNusGΔR275A,R279A (molar ratios 1:0, black; 1:0.5, yellow; 1:1, green; 1:2, blue; 1:5, red). The insert shows a blow-up of the boxed region. Arrows indicate changes of the chemical shifts during the titration. (D) 1D [1H,15N]-HSQC spectra of 71 μM 15N-tmNusGΔR275A,R279A, black, and of 26 μM 15N-tmNusGΔR275A,R279A in the presence of tmRho in equimolar concentrations, red.

