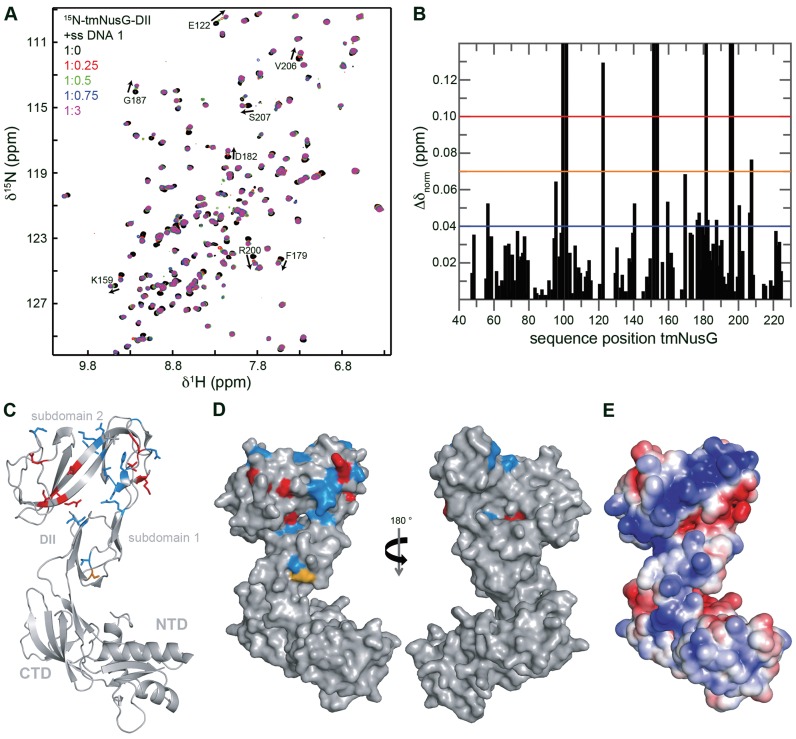
Figure 7.
The DNA binding site of tmNusG-DII. (A) [1H,15N]-HSQC spectra of the titration of 15N-tmNusG-DII with ssDNA 1. ssDNA 1 (stock concentration: 1 mM) was added to 150 μM 15N-tmNusG-DII (molar ratios 1:0, black; 1:0.25, red; 1:0.5, green; 1:0.75, blue: 1:3, magenta). Selected signals are assigned, arrows indicate changes of the chemical shifts. (B) Normalized chemical shift changes derived from the HSQC titration in (A) versus tmNusG-DII sequence position. The significance levels are indicated by horizontal lines. Δδnorm = 0.04 ppm, blue; Δδnorm = 0.07 ppm, orange; Δδnorm = 0.1 ppm, red. Gaps represent prolines and not assigned amino acids. (C and D) Mapping of the normalized chemical shift changes on the structure of tmNusG (gray, PDB ID: 2XHC) in ribbon (C) and surface (D) representation. Δδnorm > 0.1 ppm, red; 0.1 ppm > Δδnorm > 0.07 ppm, orange; 0.07 ppm > Δδnorm > 0.04 ppm, blue. (E) Electrostatic surface potential of tmNusG calculated with the program APBS (33), colored from -3 kT/e− (red) to +3 kT/e− (blue).

