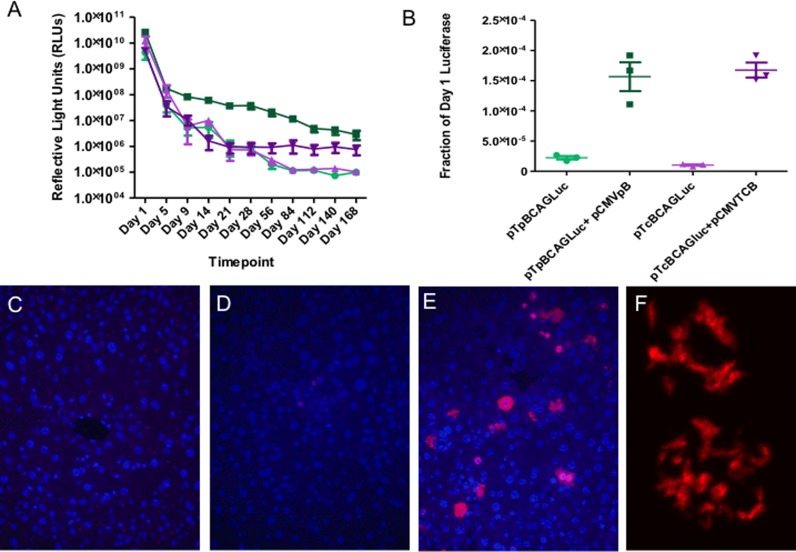
Figure 6.
The TcBuster transposon system is active in mouse liver at a low dose and forms rodlets at a high dose. (A) Mice were given hydrodynamic tail vein injections of either piggyBac transposon alone (25 μg pTpBCAGLuc; light green circles, n = 5), piggyBac transposon plus piggyBac transposase (25 μg pTpBCAGLuc + 5 μg pCMV-piggyBac; dark green squares, n = 5), TcBuster transposon alone (25 μg pTcBCAGLuc; light purple triangles, n = 4), or TcBuster transposon plus TcBuster transposase (25 μg pTcBCAGluc + 2.5 μg pCMV-TcBuster; dark purple inverted triangles, n = 5). Mice were imaged at the indicated timepoints to quantify the amount of liver-specific luciferase expression in Reflective Light Units (RLU). One-way analysis of variance indicates that the groups were significantly different (Kruskal-Wallis test, P = 0.01). (B) To compare the abilities of piggyBac with that of TcBuster to mediate long-term gene expression, the Day 112, Day 140 and Day 168 RLU values were normalized to Day 1 RLU values for each group and then graphed on a dot-plot. Unpaired two-tailed t-tests comparing the late-timepoint normalized RLU values for each system were significantly higher with transposase than without (piggyBac, P < 0.01; TcBuster, P < 0.0005), while the two transposon systems were not significantly different from each other. (C–F) Mice were hydrodynamically injected and livers harvested after 24 h were stained for the HA-tagged TcBuster transposase (red) and DNA by DAPI (blue). (C) IgG control. (D) Non-representative image of mice injected with 10 μg pTcBCAGluc and 2.5 μg pCMV-TcBuster showing the only cells with detectable HA staining in the section. (E) Representative image of mice injected with 10 μg pTcBCAGluc and 25 μg pCMV-HA-TcBuster. (F) Confocal image of representative nuclei from mice shown in (E).

