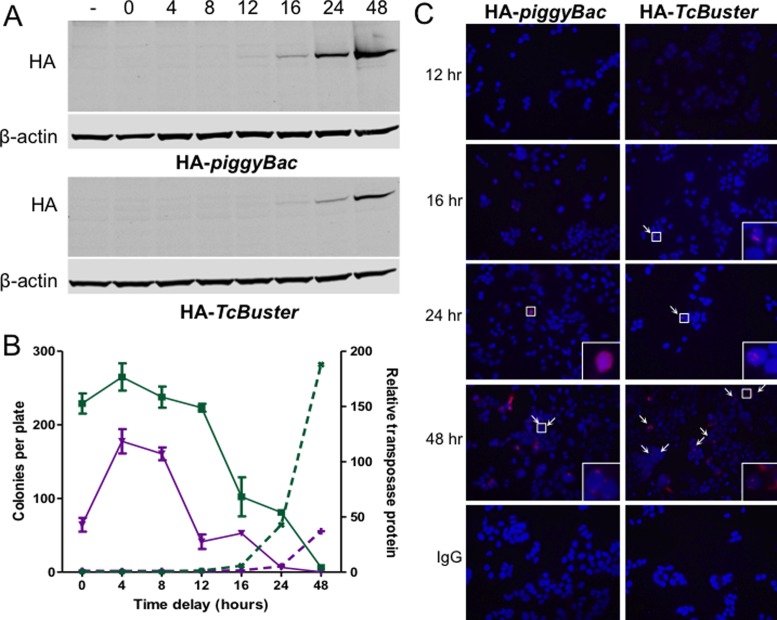
Figure 7.
The presence of transposase structures signals the end of active transposition. (A) HEK-293 cells in 10 cm plates were transfected with 800 ng of pCMV-HA-piggyBac or pCMV-HA-TcBuster and 6.7 μg of pUC19 by FuGene6. Equal amounts of the lysates obtained at various timepoints after transfection as indicated above the immunoblots (in hours). The two NuPAGE gels were run, immunoblotted, and imaged simultaneously for rat α-HA and mouse α-β-actin. (−), untransfected HEK-293 cells were the negative control. (B) To test the ability of piggyBac and TcBuster transposases to integrate transposons at various timepoints after expression, HEK-293 cells were transfected by FuGene 6 with 100 ng of pCMV-piggyBac (green squares, solid lines) or pCMV-TcBuster (purple inverted triangles, solid lines) transposase plasmid and 900 ng of pUC19 filler DNA. Cells were transfected with 1 μg of the corresponding neomycin-resistance transposon plasmid, either pTpB or pTcBNeo, at the indicated time delay after the first transfection. After 56 h the cells were split into selection media (1:2000) and colonies were counted after two weeks of selection (plotted on the left y-axis). The bands from the immunoblots shown in (A) were quantified in LiCOR Image Studio. The HA signal was divided by the β-actin signal to normalize, then each fraction was divided by the signal in the untransfected lane (−) to give the relative protein abundance over time for each transposase (piggyBac, green x's, dashed lines; TcBuster, purple +'s, dashed lines; plotted on the right y-axis). (C) Timecourse of transposase expression. HEK-293 cells were seeded onto poly-L-lysine coated coverslips and transfected via FuGene6 with 100 ng of the indicated transposase plasmid and 900 ng of pUC19 filler DNA. The coverslips were harvested by formaldehyde fixation at the indicated timepoint after transfection (12, 16, 24 or 48 h). Cells were stained for HA or with rat IgG for the negative control (red) and DNA by DAPI (blue). White arrows point to rodlets or inclusions; areas indicated by white boxes are magnified 16x in the lower right corners. Representative images are shown.

