Figure 1.
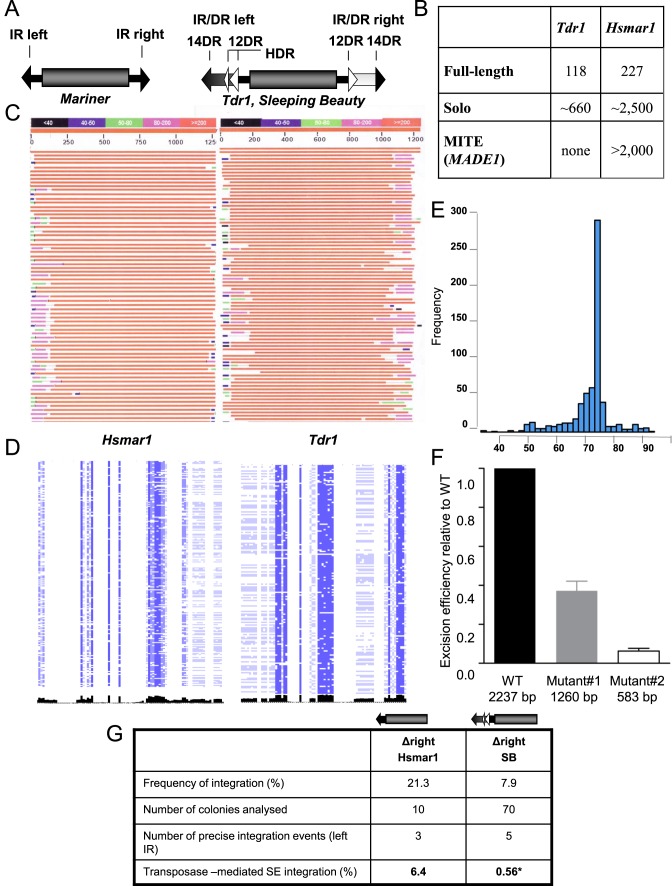
Genome wide structure of Tc1/mariner elements. (A) Structural comparison of the representatives of two subfamilies of the Tc1/mariner transposons. The transposase coding sequence (gray cylinder) is flanked by either simple- or IR/DR-type inverted repeats (IRs). In mariners, the simple terminal IRs 30 bp) contain a single recognition motif per IRs. The IR/DR elements possessing longer (230 bp) terminal IRs (arrows), with two recognition sequences (30 bp) per IRs, repeated twice in a directly repeated form (DRs). The left IR carries a transpositional enhancer motif (HDR) (13 bp) (21). (B) Genomic structure of the zebrafish Tdr1 (IR/DR) and the human Hsmar1 (IR) elements. For the definition of the categories see Materials and Methods. (C) The structure of genomic copies of the human Hsmar1 (left) and the zebrafish Tdr1 (right) elements. A graphical overview of a representative collection of a BLAST search is shown. Note the polymorphic regions at the ends of the IRs (‘self inflicted wounds’). (D) Genomic alignments of the ends of Hsmar1 and Tdr1 sequences. Pairwise alignment of left and right terminal sequences, concatenated from full-length Hsmar1 and Tdr1 (30 and 60 bp), respectively. Similarity scores are visualized in black. Note that compared to Tdr1, left and right terminal sequences are less similar to each other in Hsmar1. (E) Amplification of a specific structure of Hsmar1-derived MITEs. The genomic frequencies of various Hsmar1-derived sequences are shown. Distances between the left IR start site and right IR end site are plotted. A 78 bp long MITE variant, containing a 6 bp long intervening sequence between the 36 bp long terminal IRs (annotated as MADE1) has been amplified. Note that the number of MADE1-like sequences, including solo configuration (5 kb window) is much higher (∼8000, not shown). Here, only copies having a 100% identity to the Repbase sequence are accounted. (F) Effect of internal deletions on the frequency of Sleeping Beauty (SB) transposon excision. Wild type and two internally deleted transposon versions were subjected to an excision assay. The assay measures the restoration of the open reading frame of GFP upon transposon excision by FACS. (G) Estimating transposon-mediated single ended transposition events. Transposition frequency of Hsmar1 or SB (25,26) transposons, lacking the right IRs is shown relative to the respective wild type transposons. Wild type and mutated transposons lacking the right IRs were subjected to transposition assay in HeLa cells with active (Hsmar1-Ra; SB) or inactive (Hsmar1-cons; SB-D3) transposase versions. Integration frequencies were calculated as a ratio of colony numbers obtained with active versus inactive transposases. To identify transposon-mediated single ended (SE) integration events, the surrounding of transposon integration sites were analysed by linker-mediated PCR in the indicated number of colonies. Only precise left IR integrations (flanked by TA) to the canonical transposon target site were interpreted as single ended integration. *Data of single ended SB integration is based on (16). Δ signs refer to deletion.

