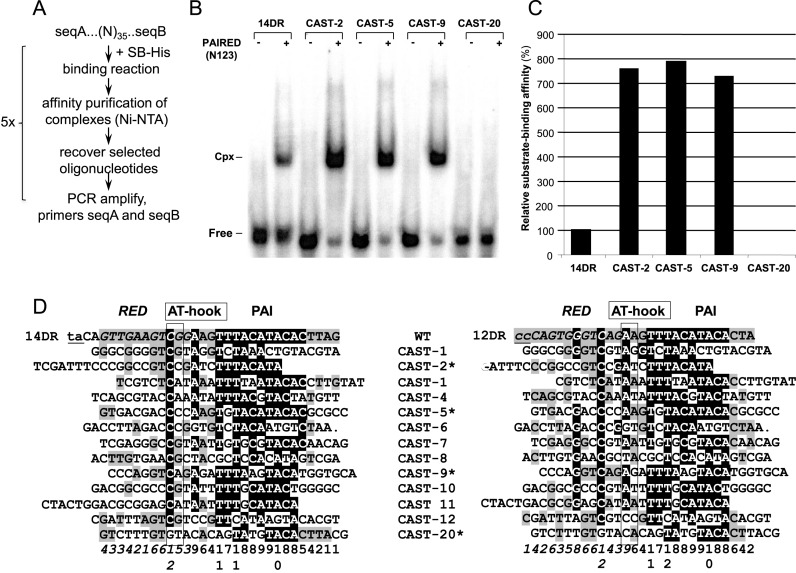
Figure 2.
Selection of optimal binding sites for the SB transposase by a molecular evolutionary strategy. (A) Flow chart of the optimization strategy (CASTing). (B) Oligonucleotides selected in six CASTing cycles were sequenced and tested in electromobility shift assay (EMSA), using the PAIRED-like DNA-binding domain of the SB transposase, N123 (21). Binding affinities were compared to the wild type 14DR motif of the SB left IR. The position of complexed (Cpx) and uncomplexed (Free) DNA probes. (C) Quantification of nucleo-protein complexes shown on Figure 2B by calculating the relative substrate-binding affinity values. (D) Alignment of CASTing selected, optimized binding sites to wild-type DR motifs. Various CAST sequences are aligned to either 14DR (left panel) or 12DR (right panel) of the left IR of the SB transposon. Binding regions aligning to RED and PAI are shown in italic and in plain, respectively. The AT-hook motifs are boxed. TA target site flanking the transposon and the corresponding nucleotides in the 12DR are in lowercase and underlined. The identity scores are shown below. Identical nucleotides are in shaded background (black – above 50%; gray – below 50%). Note that binding sites selected by the CASTing strategy are more similar to PAI versus RED (70% versus 20%). Selected CAST sequences, tested in EMSA (Figure 2B) are labeled with a star.

