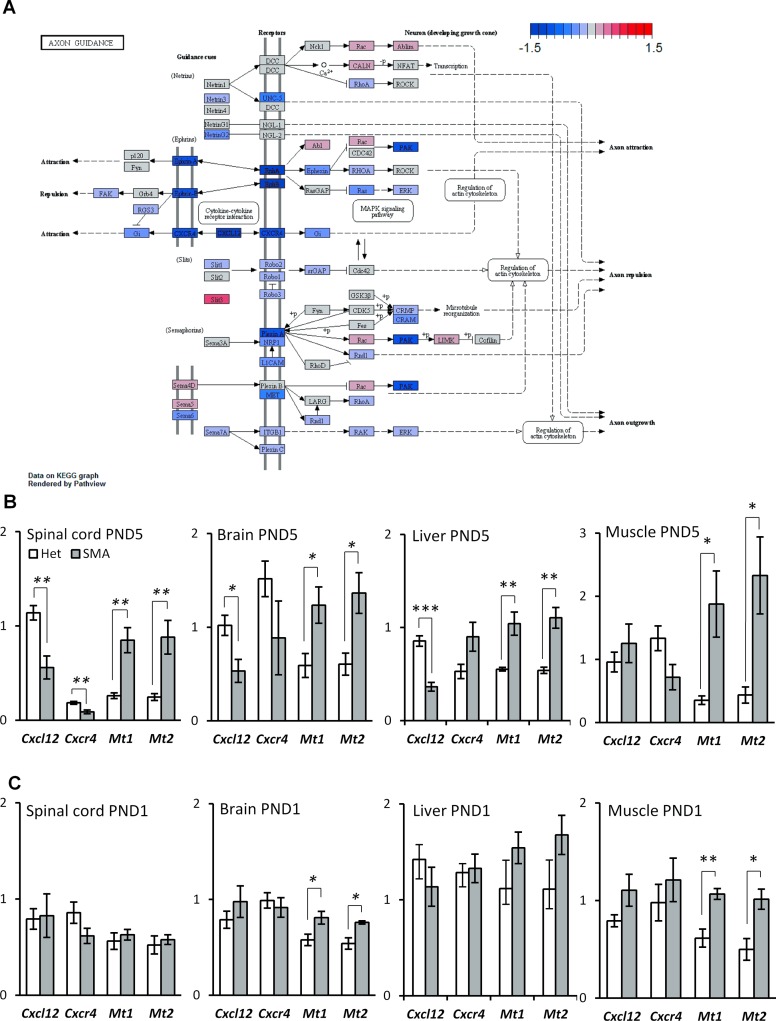
Figure 2.
Expression of axon guidance genes is down-regulated in SMA-like mice at PND5 while stress genes are up-regulated. (A) Schematic depiction of the axon guidance pathway in mice from the KEGG database. Gene regulation is indicated by a color gradient going from down-regulated (blue) to up-regulated (red) with the extremity thresholds of log2 fold-changes set to −1.5 and 1.5, respectively. (B) qPCR validation of differentially expressed genes in SMA-like mice at PND5. (C) qPCR validation of differentially expressed genes in SMA-like mice at PND1. Error bars indicate SEM, n ≥ 3, **P-value < 0.01, *P-value < 0.05. White bars indicate heterozygous control mice, grey bars indicate SMA-like mice.

