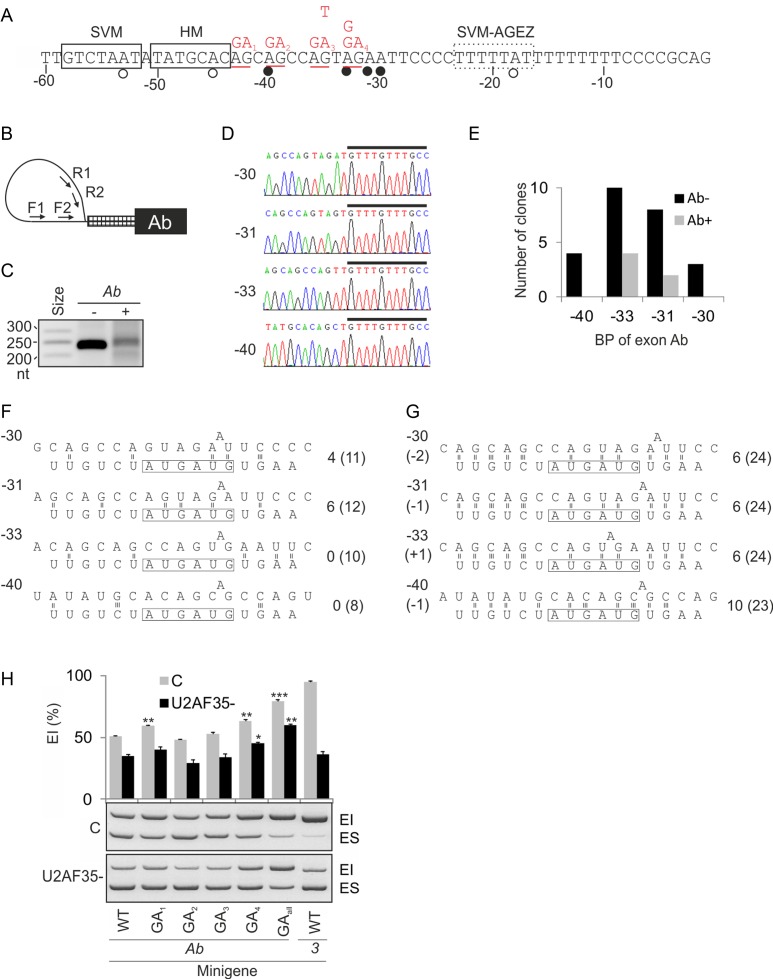
Figure 2.
U2AF1 exon Ab employs multiple noncanonical branch points. (A) Nucleotide sequence upstream of exon Ab. Predicted and experimentally determined BPs are shown by open and closed circles, respectively. Boxes denote BP heptamers predicted using the support vector machine (SVM) (45) or the comparative human-mouse (HM) (46) algorithms; a dotted box denotes a weak SVM BP heptamer (SVM score of −0.71) predicted with the AGEZ filter. The distance relative to the 3′ss of exon Ab is shown at the bottom. Mutations introduced in the Ab reporter construct (Figure 1D) are in red at the top. (B) Primers for BP mapping (Supplementary Table S1). (C) Lariat introns amplified from DBR1-depleted HEK293 cells mock-transfected (−) or transfected (+) with the Ab reporter. (D) Sequence chromatograms of exon Ab lariats. Distances of BP adenines relative to the 3′ss are to the left. A black rectangle denotes the 5′ end of U2AF1 intron 2. (E) Exon Ab BP usage in cells (mock)-transfected with the Ab reporter. (F) Predicted canonical base-pairing interactions of each BP sequence with the U2 snRNA. The BP-interacting motif of U2 snRNA is boxed. The number of predicted hydrogen bonds between the AUGAUG box of U2 and the pre-mRNA is to the right. The number of predicted hydrogen bonds between the pre-mRNA and extended single-stranded region of U2 snRNA is in parentheses. (G) Predicted alternative base-pairing for each BP. Shifts of the U2 snRNA sequence towards the 5′ (−) or 3′ (+) intron ends are shown in parentheses to the left. Hydrogen bonds are numbered to the right as in panel F. (H) Exon inclusion levels of AG mutants in U2AF35ab siRNA-treated (U2AF35-) and mock-treated (C) cells. Error bars denote SDs of duplicate transfections. Mutations are shown in panel A.

