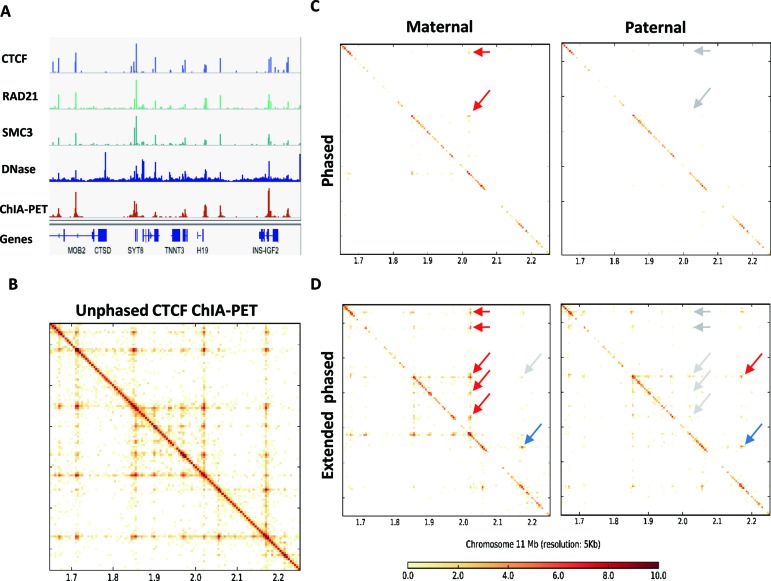
Figure 5.
Allele-specific analysis. (A) Signal of CTCF,RAD21, SMC3 ChIP-Seq, DNase-Seq and ChIA-PET peaks near the H19/IGF2 region. (B) Contact matrix generated from all valid ChIA-PET PETs. (C) Maternal contact matrix generated from maternal phased PETs (left panel) and maternal extended phased PETs (right panel). Red arrow indicates the chromatin loop and gray arrow indicates absent or attenuated peak signal. (D) Paternal contact matrix generated from paternal phased PETs (left panel) and paternal extended phased PETs (right panel). The red arrow indicates the chromatin loop and the gray arrow indicates an absent or attenuated peak signal and the blue arrow indicates that both alleles have the peak signal.

