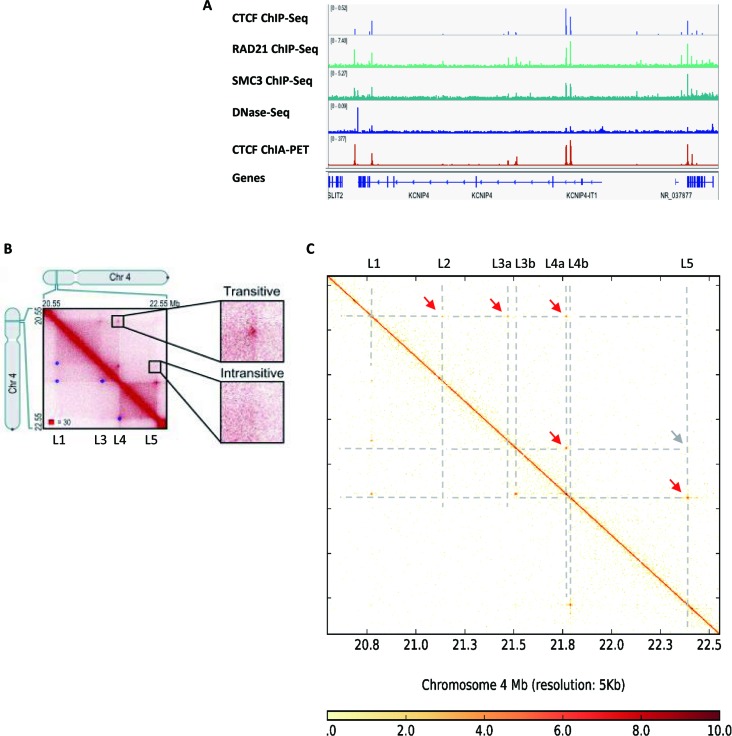
Figure 6.
Comparison with Hi-C contact map. (A) Signal of CTCF,RAD21, SMC3 ChIP-Seq, DNase-Seq and ChIA-PET peaks in a 2Mb region in chromosome 4. (B) Heatmap of contact matrix directly from Rao et al. (5) with additional annotation. (C) Heatmap of the contact matrix generated from ChIA-PET data by the ChIA-PET2 pipeline. The red arrow marks the chromatin loop and the gray arrow marks the absence of a peak signal.

