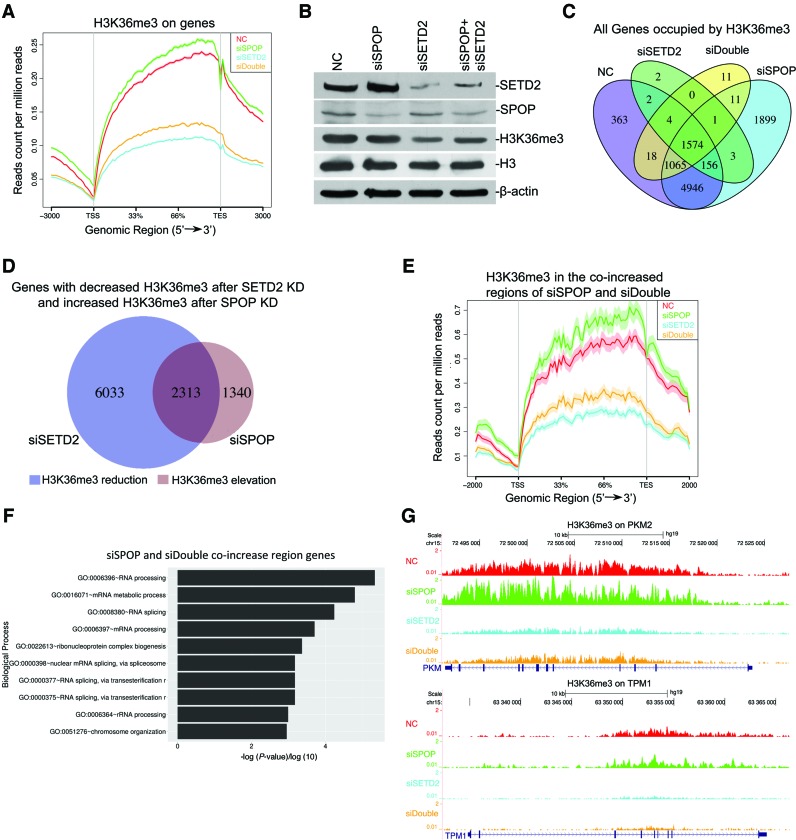
Figure 5.
Genome-wide analysis of H3K36me3 regulated by SPOP. (A) SPOP and SETD2 were knocked down by specific siRNAs separately or together in HEK293 cells. Line plot shows H3K36me3 enrichment levels in the gene body under different conditions. (B) SPOP and SETD2 were knocked down by siRNA separately or together and Western blotting was carried out to monitor knockdown efficiency. (C) H3K36me3 enrichment on the whole body of each gene locus was calculated after RPM (read per million) normalized. Venn diagram shows various overlaps of genes occupied by H3K36me3 in the cells described in (A). (D) Venn diagram shows the comparison between genes showing down-regulated H3K36me3 after SETD2 knockdown and those showing up-regulated H3K36me3 after SPOP knockdown. (E) Genes with H3K36me3 elevation both in SPOP knockdown versus control and co-knockdown versus SETD2 knockdown were selected with the Line plot showing H3K36me3 levels on their gene bodies. (F) Gene Ontology analysis shows the enriched biological processes of the genes in (F). (G) Landscape of H3K36me3 distribution on PKM and TPM1.

