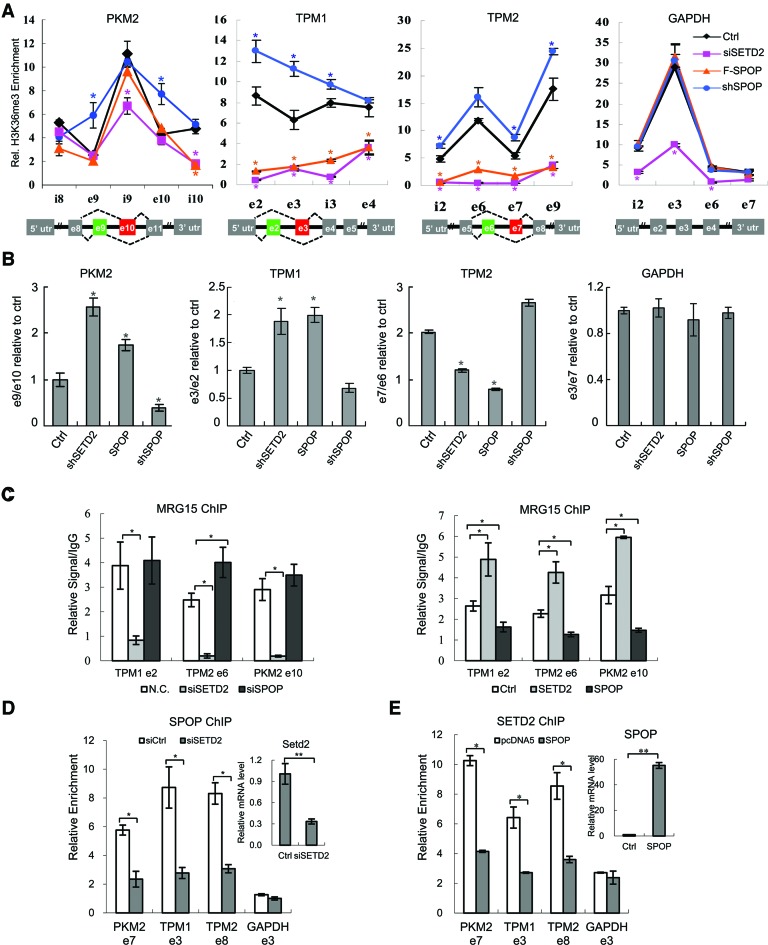
Figure 6.
SPOP modulates H3K36me3 on SETD2 target genes. (A) ChIP analysis of H3K36me3 on PKM2, TPM1, TPM2 and GAPDH genes in SETD2 shRNA, SPOP shRNA and SPOP overexpression stable cell lines. Y-axis represents relative signals of H3K36me3 over H3. (B) Specific primers were designed to detect the indicated exons of PKM2, TPM1 and TPM2, as reported (11), and individual alternative splicing events were measured by quantitative PCR and represented by the ratios of different exons. GAPDH was used as control. (C) ChIP analysis of MRG15 on TPM1, TPM2 and PKM2 genes under indicated conditions. Y-axis represents relative MRG15 signals over IgG control. (D) ChIP analysis of SPOP on PKM2, TPM1, TPM2 and GAPDH genes in SETD2 knockdown cells. Y-axis represents relative SPOP signals over IgG control. (E) ChIP analysis of SETD2 on PKM2, TPM1, TPM2 and GAPDH genes in SPOP overexpression cells. Y-axis represents relative SETD2 signals over IgG control. *P-value < 0.05; **P-value < 0.01. n = 3.

