Figure 5.
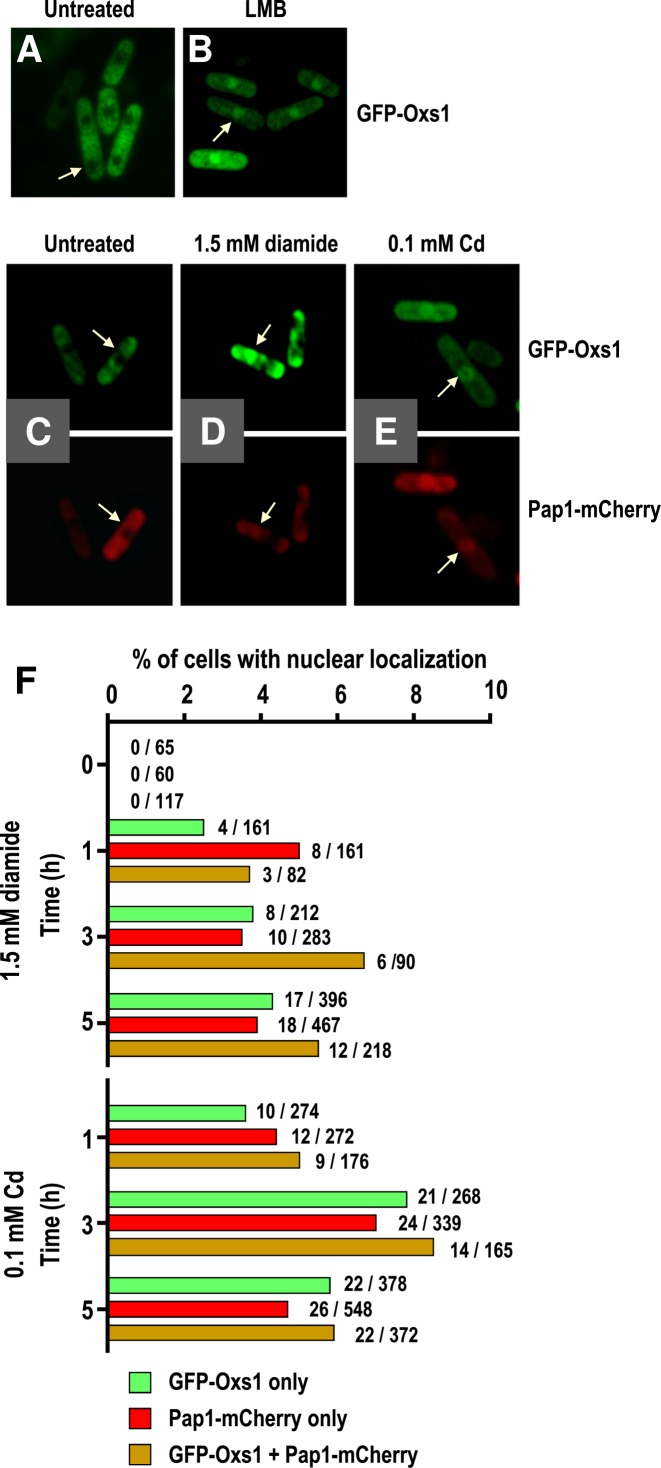
Stress-induced nuclear localization by Oxs1 and Pap1. Representative fluorescence microscopy of GFP-tagged Oxs1 or mCherry-tagged Pap1 fusion protein. Plasmid pART1-produced GFP-Oxs1 in WT cells treated without (A) or with (B) LMB. (C–E) Plasmid pART1-produced GFP-Oxs1 or pSLF173-produced Pap1-mCherry without or with treatment of 1.5 mM diamide or 0.1 mM Cd for 1 h. (F) Percentage of cells scored as GFP only, as mCheery only, or as having both GFP and mCherry signals in the nucleus. Number of cells scored positive over total cells counted shown to the right of each bar.

