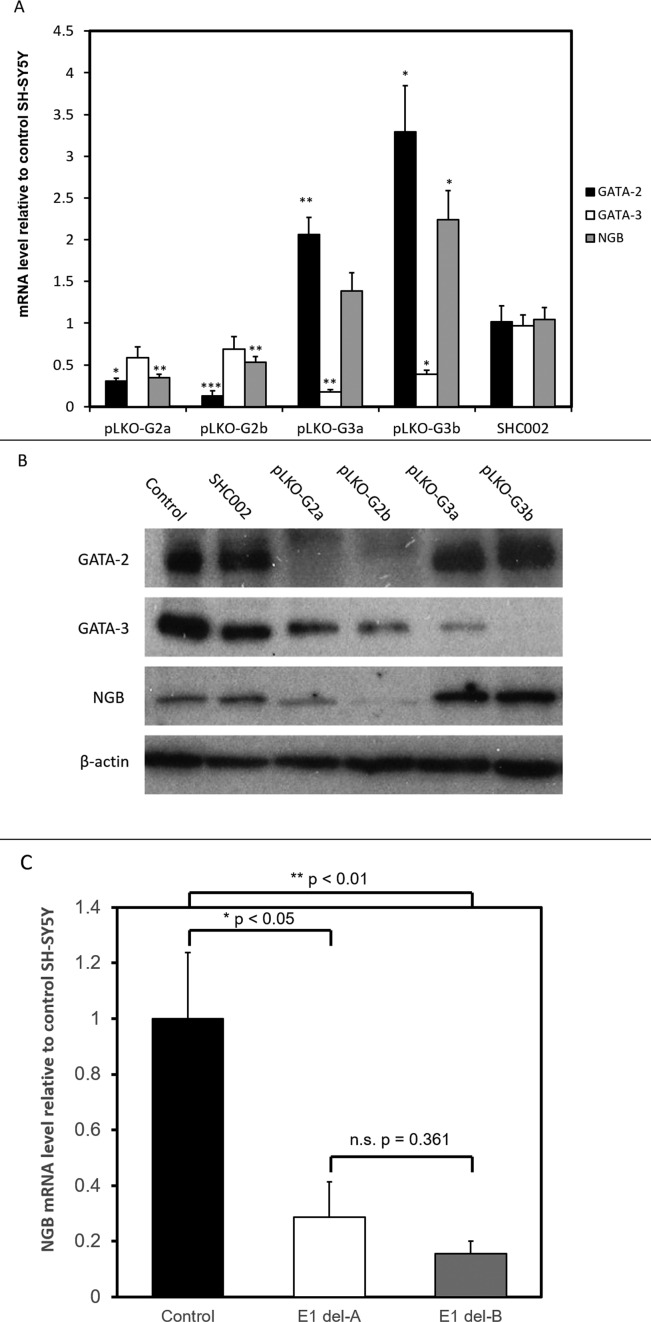
Figure 4.
(A) The mRNA level of GATA-2, GATA-3 and NGB upon GATA factor knockdown. cDNA was synthesized from total RNA extracted from untreated SH-SY5Y cells (Control), and cells infected with control shRNA vector (SHC002) or GATA-2 (pLKO-G2a and pLKO-G2b) or GATA-3 (pLKO-G3a and pLKO-G3b) targeting shRNA constructs. The amount of mRNA is normalized to β-actin level, and expressed relative to the level in control SH-SY5Y cells. *P < 0.05, **P < 0.01, ***P < 0.001 compared to SHC002 SH-SY5Y cells (N = 3, mean ± SEM). (B) Western blot analyses of GATA-2 and -3 knockdown SH-SY5Y cells. Proteins were extracted from untreated SH-SY5Y cells (Control), and cells infected with control shRNA vector (SHC002) or GATA-2 (pLKO-G2a and pLKO-G2b) or GATA-3 (pLKO-G3a and pLKO-G3b) targeting shRNA constructs. Bands shown are from three different membranes (one for control and SHC002, one for pLKO-G2a and b, and one for pLKO-G3a and b). The amount of protein loaded and exposure times were kept constant for each membrane. (C) mRNA level of NGB in SH-SY5Y cells with and without Element I deletion. Del-A and -B are cells with Element I deleted by different gRNA pairs. The levels are normalized to β-actin level and expressed relative to the level in control SH-SY5Y cells. *P < 0.05, **P < 0.01 compared to control SH-SY5Y cells (N = 3, mean ± SEM).

