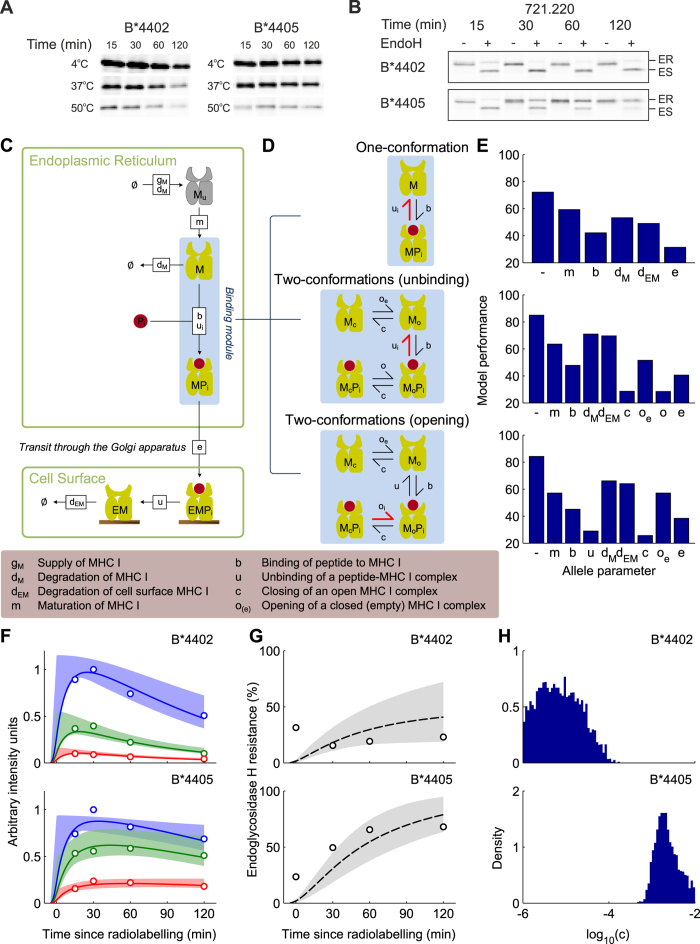
Figure 2. Computational systems models of the mechanisms of MHC I peptide selection, fit to in vivo peptide selection data for B*4402 and B*4405 in the absence of tapasin.
(A) Time-dependent peptide selection measured with pulse-chase and thermostability in tapasin-deficient cells, as described in materials and methods. Tapasin deficient cultured 220 cells (721.220) were metabolically radiolabelled with 35S-met for 5 min, then chased for the indicated times before being lysed and heated to the temperatures shown (data quantified in F). (B) Cell surface transit measured as percentage endoglycosidase-H (EndoH) resistance. MHC I was immunoprecipitated with W6/32 and treated at the different time points with (+) or without (−) EndoH, which distinguishes between sensitive, pre-cis-Golgi (ES) and resistant (ER) post-cis-Golgi MHC I (data quantified in G). Immunoprecipitations were performed in such a way as to record only MHC I bound to high affinity peptides (10). (C) A general computational systems model of the mechanisms of peptide selection in the absence of tapasin. Shapes represent molecular species and labelled boxes represent reactions and their rate parameters. (D) Different binding mechanisms are illustrated for one-conformation and two-conformation models, where peptide-dependent reactions are indicated by thick red symbols. (E) Comparison of model performance for different parameters taking allele-specific values (allele parameters). The most likely model (lowest BIC score) was the two-conformation model with MHC I opening as the peptide-dependent step and MHC I closing rate c as the allele-dependent parameter. (F,G) Comparison of the most likely model (solid lines) against experimental measurements (circles), with 95% confidence intervals (shaded regions). (F) Quantification of pulse chase experiments shown in panel A (circles), together with model simulations (lines). Red indicates the proportion of MHC I molecules that remained after heating to 50 °C (high affinity peptide-MHC complexes), green indicates heating to 37 °C (medium and high affinity complexes) and blue indicates heating to 4 °C (all complexes). (G) Quantification of cell surface transit experiments shown in panel B (circles), together with model simulations (lines). (H) Marginal posterior density of the allele-specific closing rate c, reflecting the probability of the parameter values, conditional on the measured data and underlying model.

