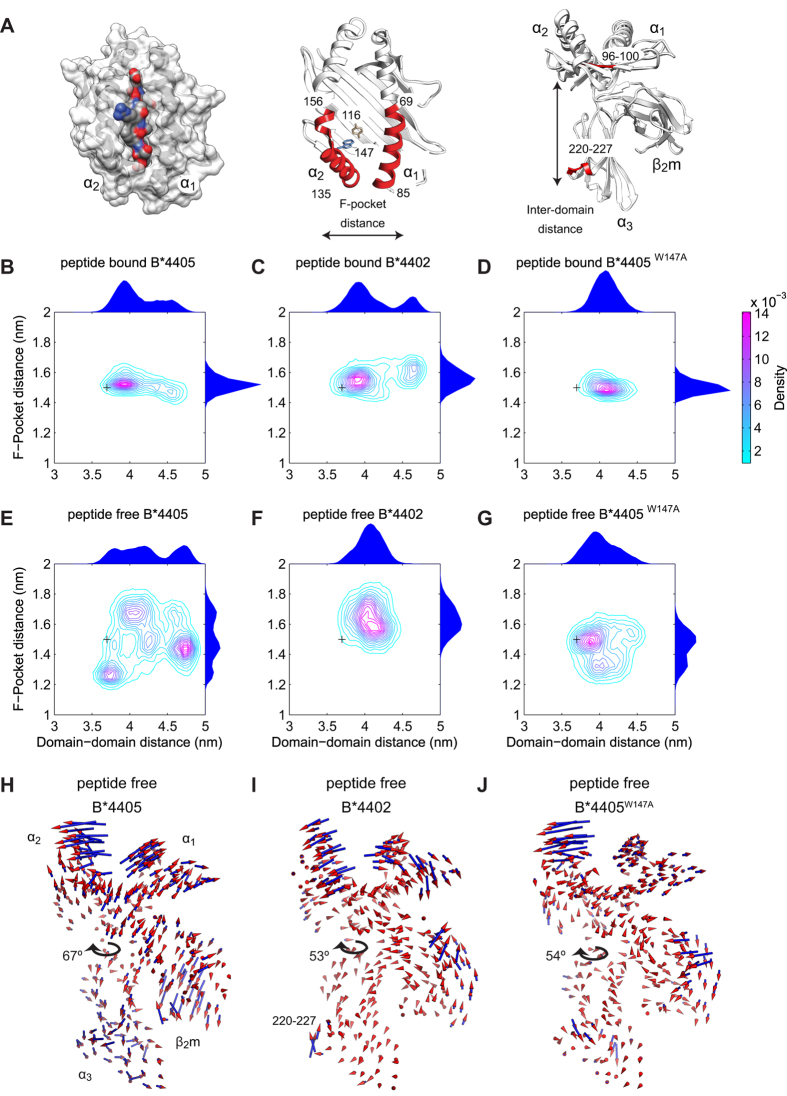
Figure 3. Quantification of protein plasticity for MHC I alleles B*4402, B*4405 and B*4405W147A from molecular dynamics simulations.
(A) Left: Surface representation of peptide bound MHC I. Middle: Ribbon representations of peptide free MHC I. The polymorphism between B*4402 and B*4405 at position 116 in the peptide binding groove (brown) and mutation B*4405W147A (blue). F-pocket distances were measured between the center of mass of helix residues 135–156 and 69–85 (red). Right: Inter-domain distances were measured between peptide binding groove residues 96–100 (red) and α3 residues 220–227 (red). (B–G) Contour plots of the joint probability densities for the conformations of MHC I populated in each simulated condition, as defined by distances in (A). Black crosses indicate the initial structure conformation. Distributions for each individual distance are plotted on the outside of the adjacent axis. (H–J) The motion most correlated with the distance fluctuations across the F-pocket as defined in (A). Cones indicate the direction and amplitude of motion. The range of inter-domain twisting for each molecule is indicated by arrows (as depicted in Figure S5). See also Figures S1–S5.

