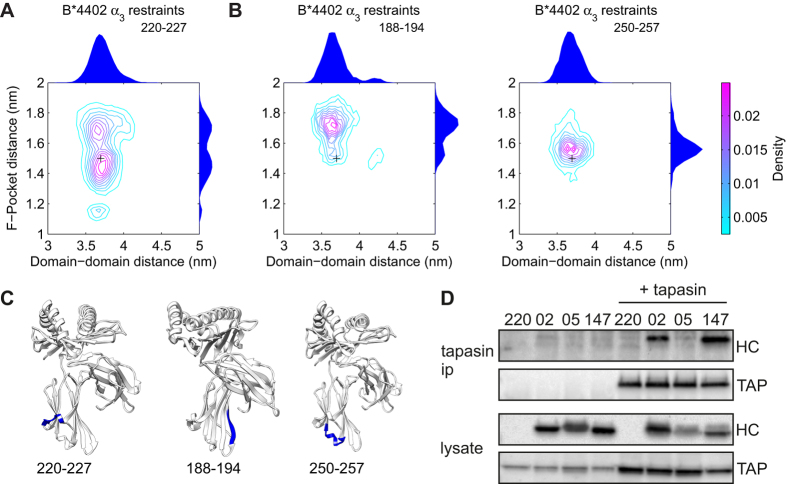
Figure 5. Quantification of B*4402 plasticity with restrained residues at the tapasin binding site, and measurement of tapasin binding for B*4402, B*4405 and B*4405W147A.
(A) Contour plots of the joint probability densities for the conformations populated by peptide free B*4402 with restrained α3 domain residues 220–227, the location indicated in panel (C). Black crosses indicate the initial structure conformation. Distributions for each individual distance are plotted on the outside of the adjacent axis. Restraint of these residues increases B*4402 plasticity by modulating the peptide binding groove conformation. (B) Contour plots of the joint probability densities for the control simulations, the locations are indicated in panel C. Black crosses indicate the initial structure conformation. Distributions for each individual distance are plotted on the outside of the adjacent axis. Restraint of control residues has little effect on B*4402 plasticity. (C) Sites of the restraints on MHC I corresponding with simulations in panels A and B. (D) B*4405W147A exhibits sustained binding to tapasin, like B*4402, whereas B*4405 does not. Cells were lysed in digitonin to preserve the peptide loading complex, which was then immunoprecipitated with anti-tapasin antibody. Associated transporter associated with antigen processing (TAP) and MHC I (HC) were visualized by Western blot using specific antibodies. See also Figures S1-S5.

