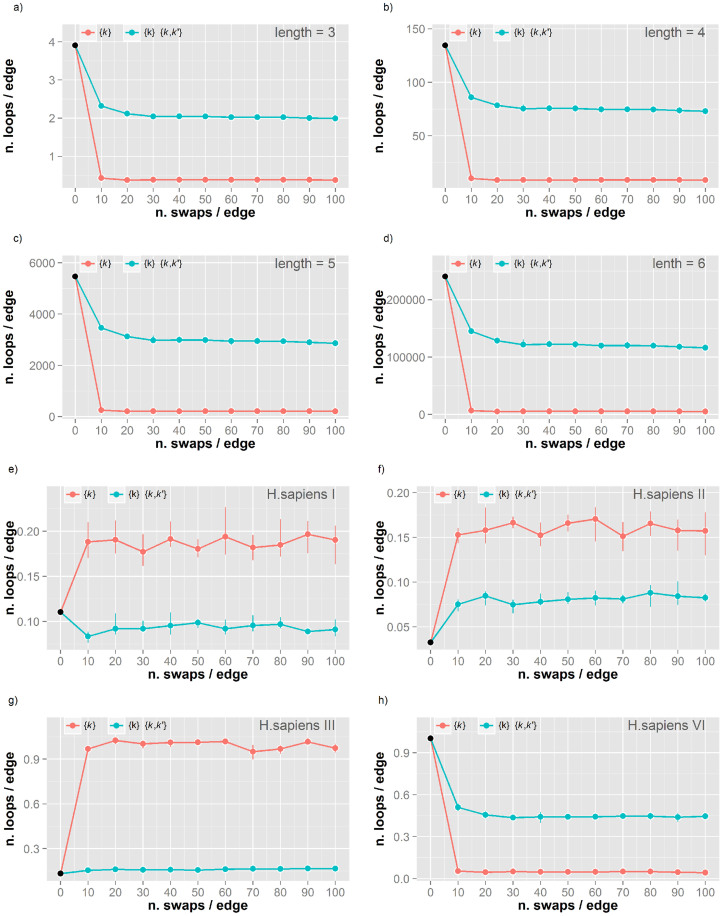
Figure 1.
(a–d) Number of loops of length 3–6 in the H. sapiens V (BP-MS) network during randomisation. The number of loops per edge during Markov Chain Graph Dynamics (MCGD) is reported for loops of length 3 (a), 4 (b), 5 (c) and 6 (d) in the H. sapiens V (BP-MS) network. Simulations were performed under two set of constraints: 1) degree distribution {k} (red line) and 2) both degree distribution {k} and degree-degree correlation {k,k′} (blue). (e–g) Number of loops of length 3 in four different H. sapiens networks during randomisation. The number of loops per edge during MCGD is reported for loops of length 3 in four human PPINs from different experimental techniques and research groups: H. sapiens I (e), II (f), III (g) and VI (h). Colour coding as in Figure 2a. Details on network properties, experimental techniques and related literature references are reported in Table 1.

