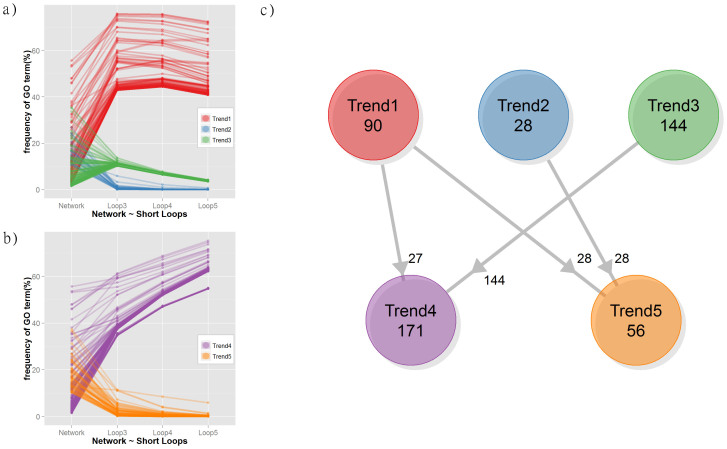
Figure 6. Frequency of GO terms in loops of length 3–5 and in the network of H. sapiens V (BP-MS).
The plots report the relative frequency (in %) of GO terms in the network and in loops of length 3, 4 and 5: (a) H. sapiens V (BP-MS) and (b) H. sapiens V (BP-MS) without the largest ribosomal complex. The values for each GO term are coloured according to their trend: higher frequencies in the loops than in the network (Trend 1 in red and Trend 4 in purple); higher frequency in the network (Trend 2 in blue and Trend 5 in orange) and lower frequencies in the loops with a consistent value independent by the loop length (Trend 3 in green). The relationship between terms before and after the removal of ribosomal proteins is summarised in the diagram in panel (c).

