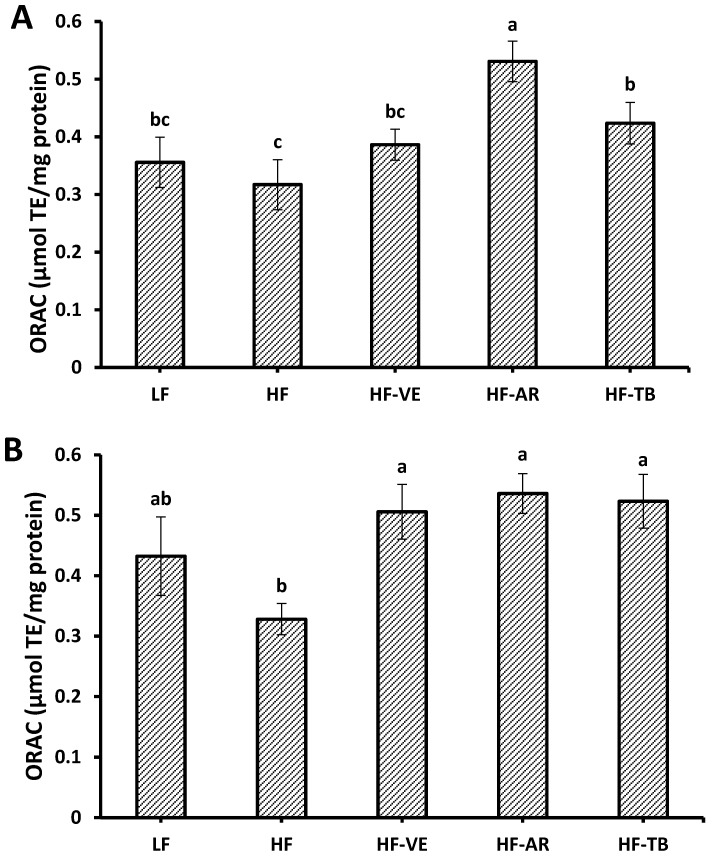
Figure 5.
Total antioxidant activity in liver (A) and heart tissue of mice as evaluated by the ORAC method (B). LF: group fed standard low-fat diet; HF: group fed high-fat diet; HF-VE: group fed HF diet with 0.5% VE added; HF-AR: group fed HF diet with 0.5% ARs extract added; HF-TB: group fed HF diet with 10% TB. Bars represent mean ± SE. Data were statistically analyzed using one-way ANOVA and DMRT where statistical differences among groups (p < 0.05) are represented by different letters.

