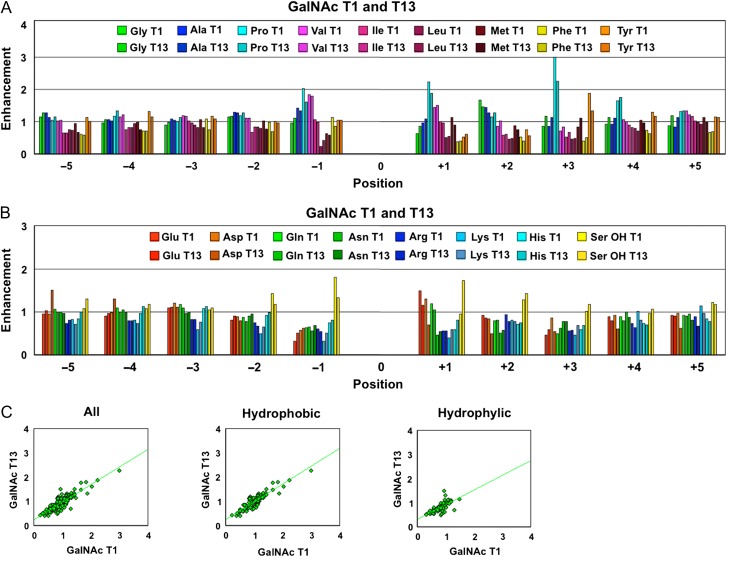
Fig. 1.
Plots of the peptide substrate preferences of GalNAc-T1 and T13 obtained from random peptide substrates, showing their near-identical catalytic domain peptide substrate specificity of these transferases. Comparison plots of the hydrophobic (A) and hydrophilic (B) amino acid (AA) residue enhancement values for GalNAc-T1 and T13. (C) The enhancement values for GalNAc-T13 plotted against those for GalNAc-T1 for all residues (left panel, r2 = 0.75), the hydrophobic residues (middle panel, r2 = 0.81) and the hydrophilic residues (right panel, r2 = 0.49). Note that in A and B position 0 represents the glycosylated Thr in the random peptide substrates as described in the Materials and Methods section. Enhancement values greater than 1 suggest that the transferase has a high preference for the residue, while values significantly less than 1 suggest that the residue exerts an inhibitory effect on the transferase. See Supplementary data (Figures S1 and S2) for the comparison of individual AA residue preferences and their standard deviations. Data for GalNAc-T1 was taken from Gerken et al. (2011). This figure is available in black and white in print and in color at Glycobiology online.

