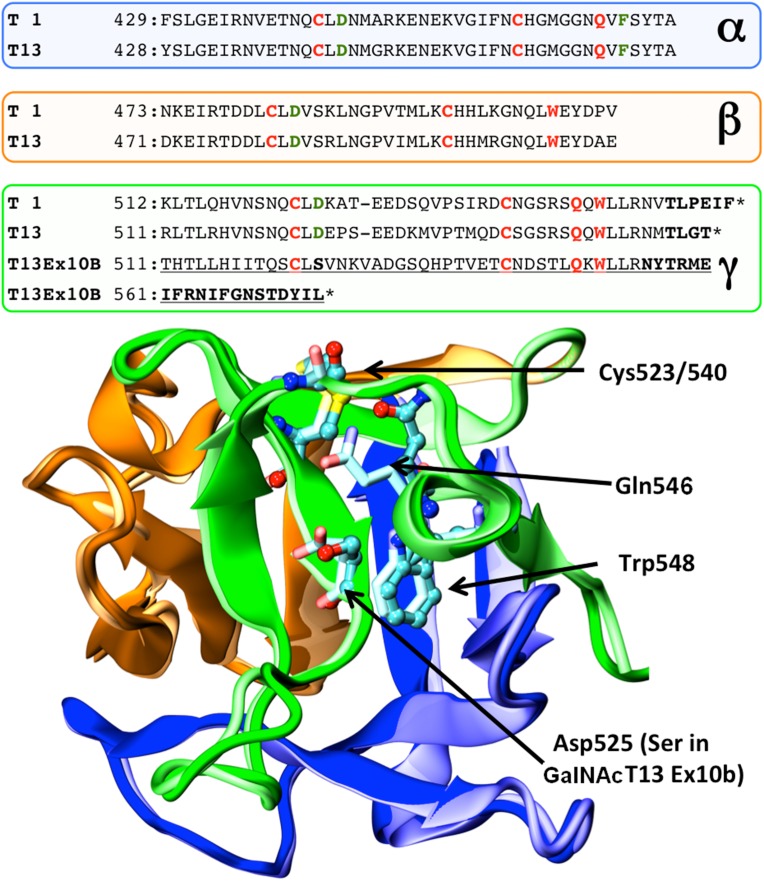
Fig. 3.
Structural model of GalNAc-T13 Ex10b. Top: sequence alignment of GalNAc-T1, GalNAc-T13 and GalNAc-T13 Ex10b in the region comprising the lectin domain. Each colored panel represents from top to bottom the three α, β, and γ-lectin subdomains. Identical residues in the GalNAc-T family are shown in red, whereas highly conserved residues are shown in green. Bold letters indicate putatively unstructured regions of the protein. Asterisks indicate the C-terminal end of the protein. Notice that the change in sequence introduced by Ex10b coincides with the beginning of the γ-subdomain. Bottom: structural superposition of the lectin domains of GalNAc-T1 (pale colors) and a homology model of Ex10b (vivid colors) looking in the direction of the γ-lectin subdomain sugar binding site. The cartoon is colored according to subdomains with the conserved residues displayed as sticks for GalNAcT-1 and balls and sticks for GalNAcT-13/Ex10b. Numbers correspond to GalNAc-T1 residues. This figure is available in black and white in print and in color at Glycobiology online.

