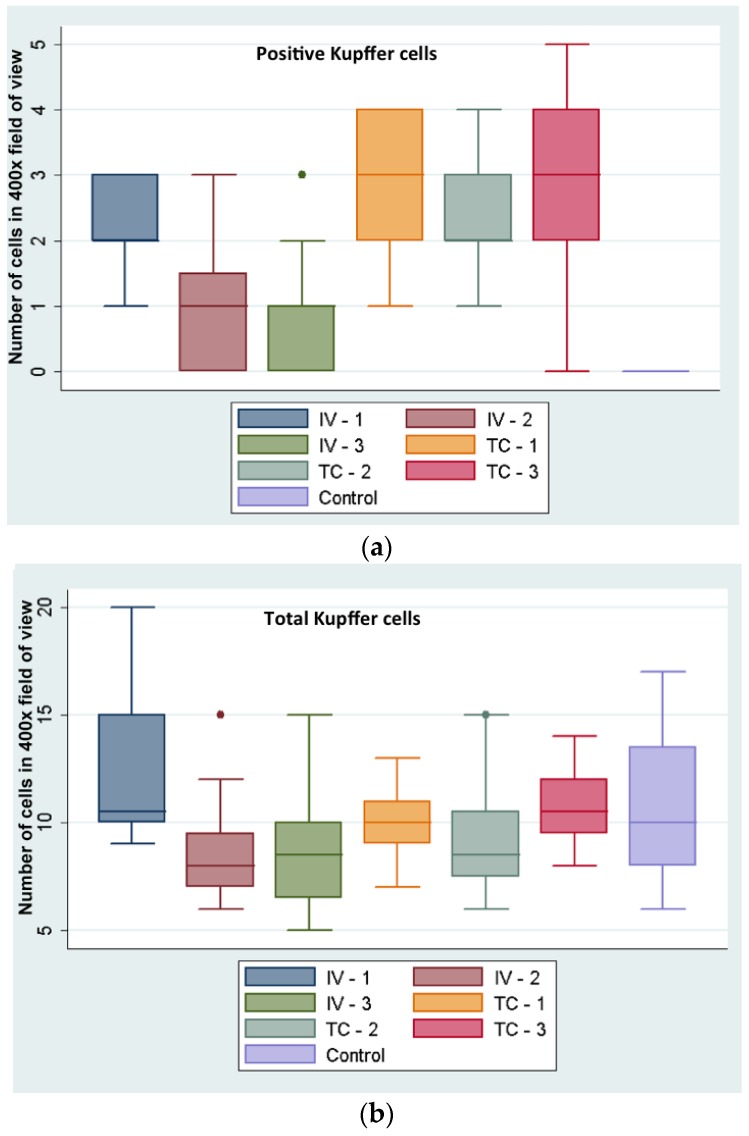
Figure 4.
(a) NP positive Kupffer cells and (b) total number of Kupffer cells in livers of intravenous (IV) and intra-catheter (IC) injected and control rabbits. Y-axis indicates total number of Kupffer cells per field of view, averaged from 20 such areas, images acquired at 400× (for example, see one such area of view in Figure 3i).

