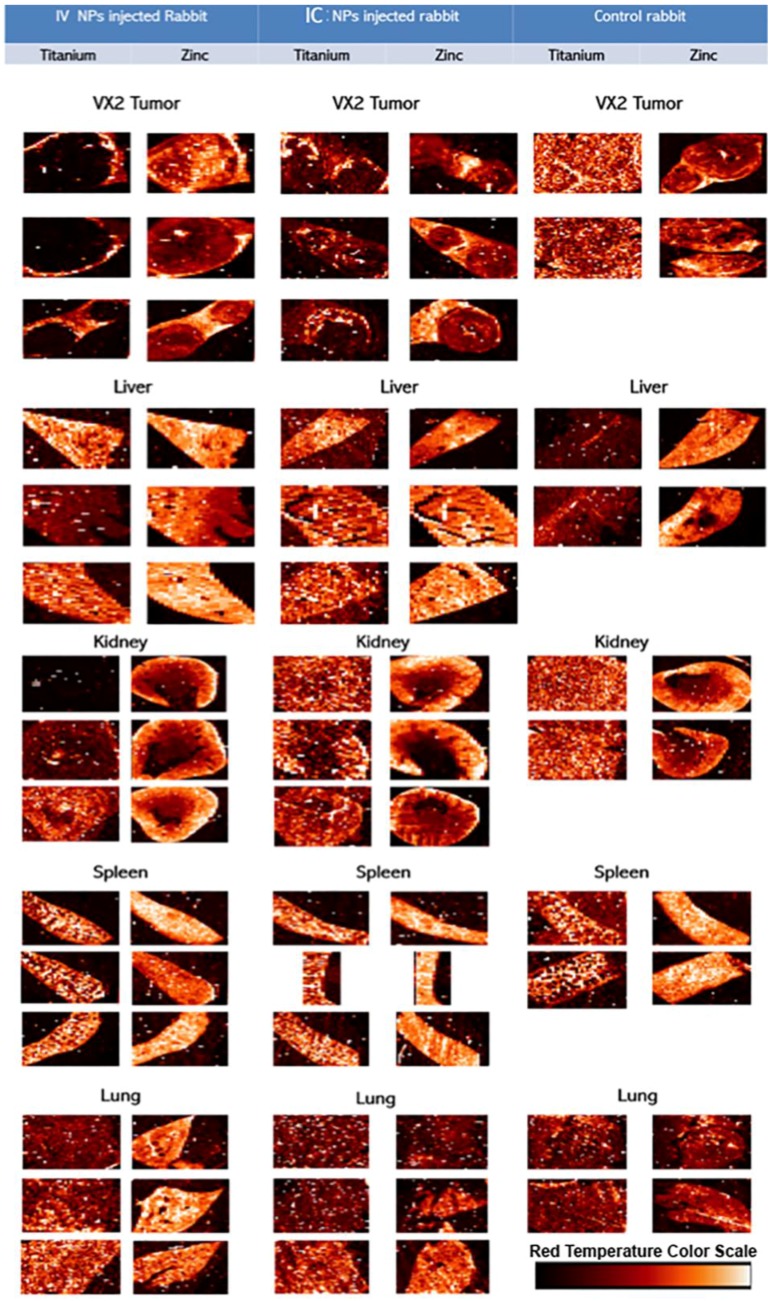
Figure 5.
Overview of XFM images for NP distribution after intravenous (IV) and transarterial intra-catheter (IC) injections into control rabbits VX2 tumor and liver, kidney, lung, and spleen tissues. The mapping for the Titanium (left) and Zinc (right) concentrations and content informs about tissue shape, and potentially even its health status. It should be noted that these are false color images showing distribution of elemental concentrations from the lowest (black to brown) to highest (yellow to white) within the elemental concentrations distribution of each sample (see color scale bar in lower right depicting spectra of colors matching lowest concentration (in a given sample)—black) to highest (white) across a “red temperature” scale. Thus, samples with very low elemental concentrations for a given element (e.g., Ti in control samples) show a “salt and pepper” pixel distribution indicating that background signal levels predominate in the sample. It should be noted that paraffin embedding disrupts distribution of free ions such as potassium, while sulfur and zinc distributions still well represent a tissue outline because Zn finger proteins are accumulated in each cells’ nucleus [14,15,16,17,18,19]. Distribution of nanoparticles, much larger and insoluble in situ, is considered to be accurately depicted by XFM [14,15,16,17,18,19].

