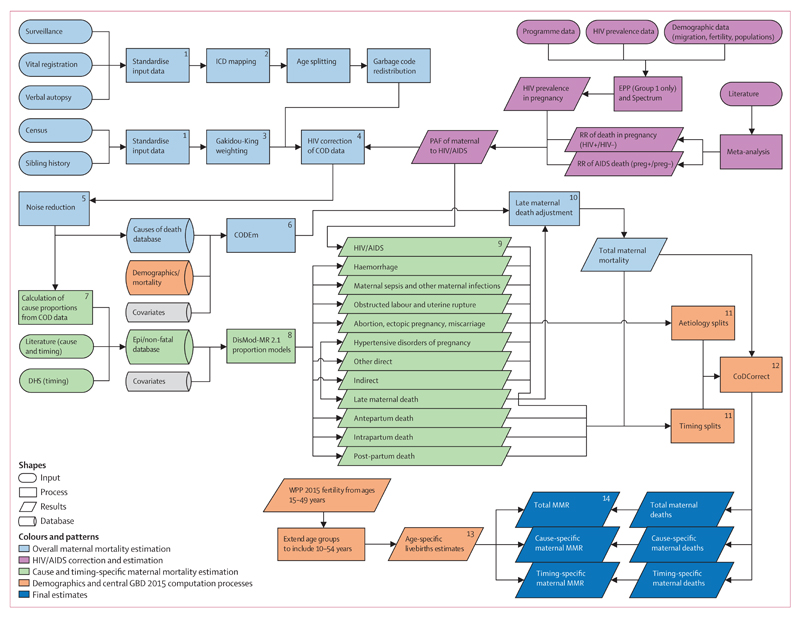
Figure 1. Analytical flow chart for the estimation of maternal mortality for GBD 2015.
Ovals represent data inputs, square boxes represent analytical steps, cylinders represent databases, and parallelograms represent intermediate and final results. Numbers are steps of the prcoess. The flowchart is colour-coded by major estimation component: data preparation and overall maternal mortality in blue; cause-specific and timing-specific estimation in green; analysis and data specific to the role of HIV/AIDS in maternal mortality in pink; steps related to demographic and computational processes that ensure internal consistency in orange, and final estimates in dark blue. GBD=Global Burden of Disease. ICD=Internatinal Classification of Diseases. COD=causes of death. Epi=epidemiology. DHS=Demographic and Health Survey. CODEm=causes-of-death ensemble modelling. RR=relative risk. MMR=maternal mortality ratio. WPP=World Population Prospects. EPP=Estimation and Projection Package. RR=relative risk. Preg+=pregnant. Preg–=non-pregnant.

