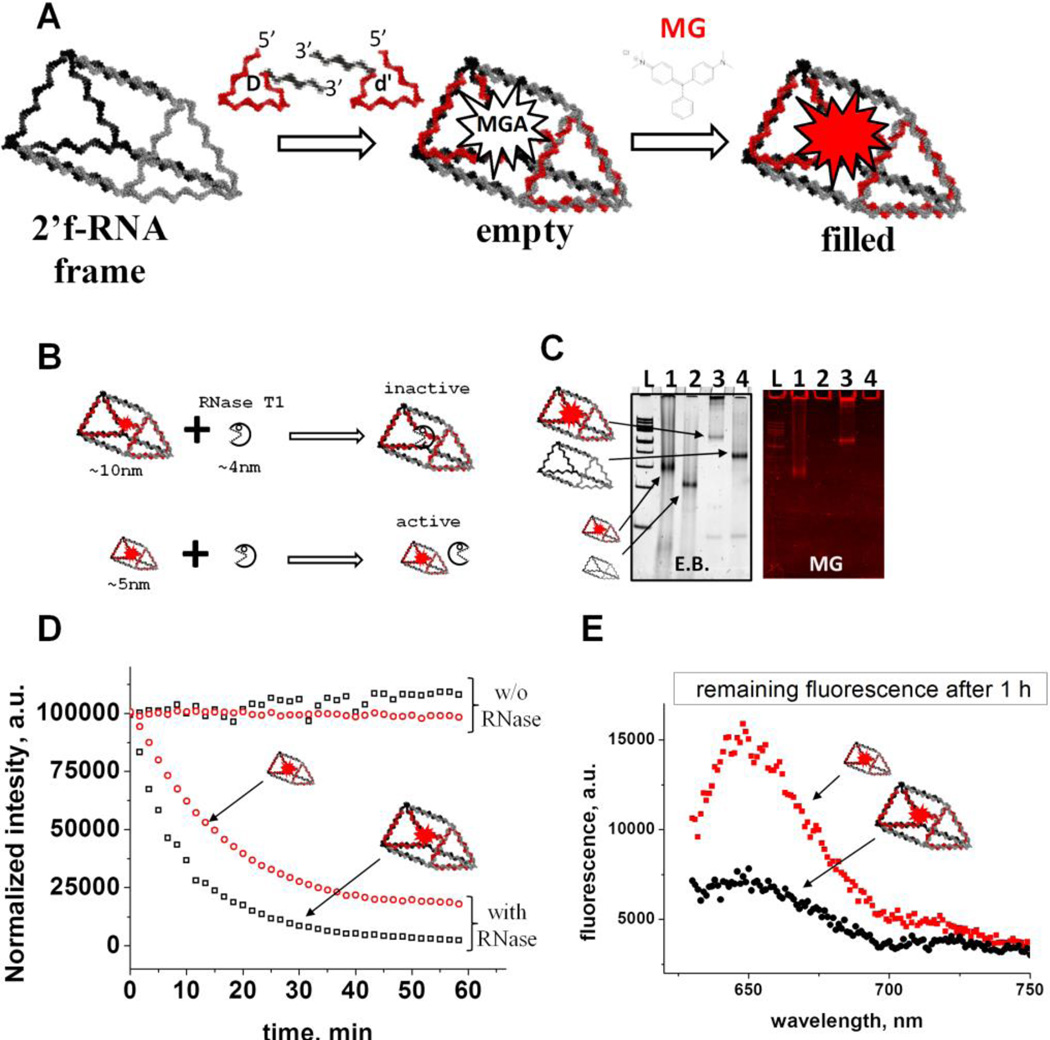
Figure 3. Encapsulation of the RNA MGA and fluorescence assay.
A. Schematic design approach for the RNA MGA encapsulation. The RNA MGA sequence is embedded within the 3’-end of D and d’ strands. Upon hybridization MGA folds into native conformation. B. Schematic representation of the RNase T1 protection experiment demonstrating the relative dimensions of RNase T1 and nanoprisms. C. Assembly efficiency and relative migration of the triangle prisms on native 6% PAGE. The smaller RNA prism migrates much faster compared to the regular prism and emits fluorescence signal indicating proper folding of the functional RNA complex. Lane “L” is 100 bp DNA ladder (Thermo Scientific). D. Time-dependent fluorescence emission profile of the 0.1 µM RNA MGA aptamer in the presence of 500U of RNase T1 and its absence (control). E. The remaining fluorescence signal of the triangle prisms after one hour of RNase T1 treatment.

