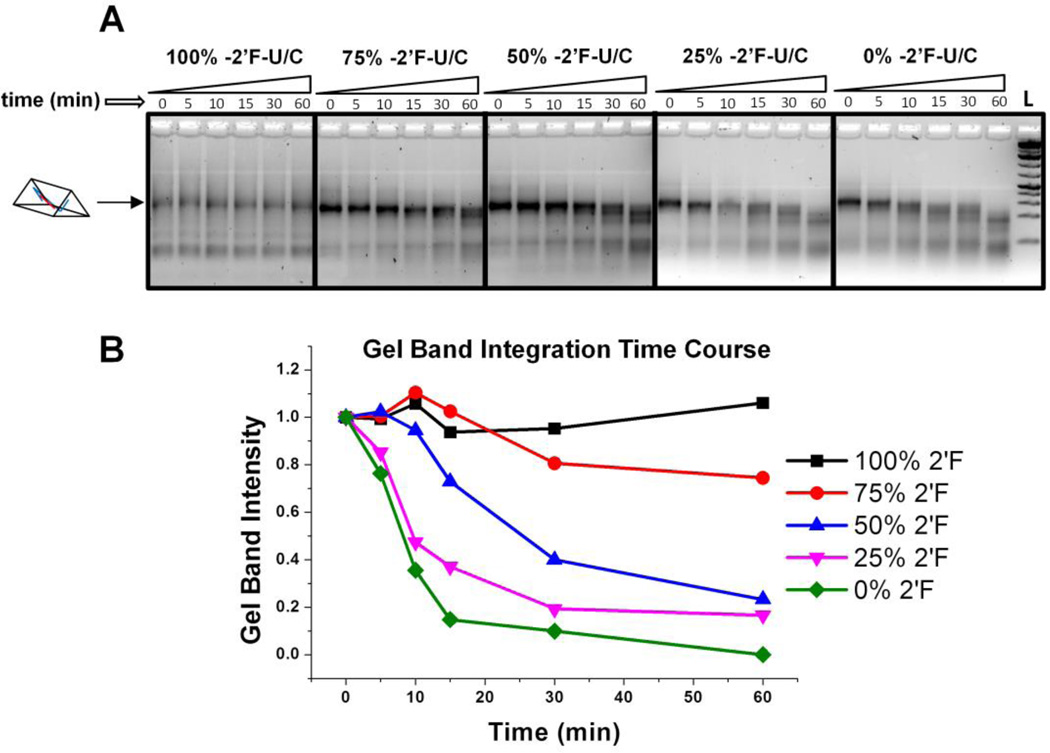
Figure 4. Tuning degradation profile of nanoprism in fetal bovine serum.
A. Gel images of nanoprisms with different percentages of 2’-F modified pyrimidines used during assembly. Nanoprisms of 200 nM concentration were incubated in 2% FBS solution and analyzed by 3% agarose gel. B. Prism relative gel band intensity plotted versus time. The intensity of each band was compared to the zero time point for each nanoprism.

