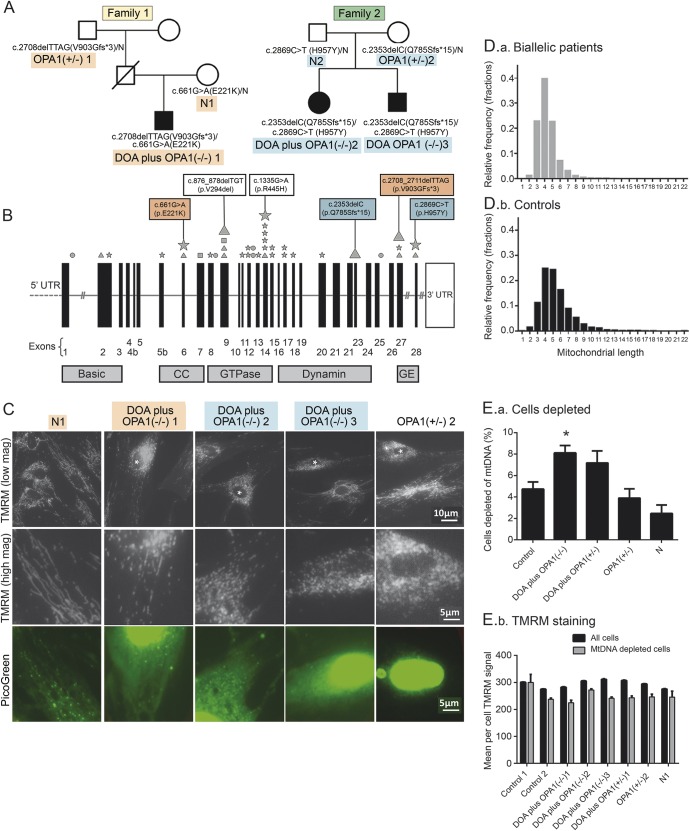
Figure 1. Genetic analysis of a family with a very severe dominantly inherited optic atrophy (DOA) plus phenotype.
(A) Pedigrees of families 1 and 2. (B) OPA1 gene structure. Diagrammatic representation of the OPA1 gene. The diagram indicates the location both of mutations resulting in DOA plus syndromes as described8 (small symbols) and of the mutations reported in this study (large symbols; highlighting corresponds to pedigree). Mutation type: stars (missense); squares (nonsense); circles (splice site); triangles (deletion). CC = coiled-coil domain; GE = GTPase effector domain; UTR = untranslated region. (C) PicoGreen/tetramethyl rhodamine methyl ester (TMRM) costaining of live fibroblasts from biallelic DOA plus OPA1(−/−)1–3 patients, and their symptom-free mothers (N1 and OPA1[+/−]2; see A). PicoGreen stains DNA and TMRM is sensitive to mitochondrial membrane potential. Nuclei of cells exhibiting mitochondrial fragmentation are marked with an asterisk. PicoGreen panel shows the same field as the high-magnification TMRM panel. TMRM staining of cells from biallelic DOA plus patients with abnormal mitochondrial fragmentation were often also depleted of mtDNA (E), but this was more marked in the siRNA-treated cell cultures in figure 2. (D) We used IN Cell 1000 to measure the mean mitochondrial length in fibroblast cultures, stained either with TMRM and PicoGreen25,26 or with antibody to mitochondrial protein Tom20. Cultures were grown for 3 days in 96-well plates in triplicate. To quantify the degree of mitochondrial fragmentation, we measured the average mitochondrial length in each cell and plotted a frequency distribution. This shows that while the modal length was similar in both groups, the per cell average mitochondrial length was shorter in biallelic patients (D.a) than controls (D.b) (see also figure e-3). (E) Cells depleted of mtDNA are increased (E.a) and have a lower membrane potential by TMRM staining (E.b). Error bars are 1 standard error. Asterisks indicate p < 0.001 compared to controls (2-tailed t test). Each bar represents between 400 and 1,500 cells. mtDNA = mitochondrial DNA.

