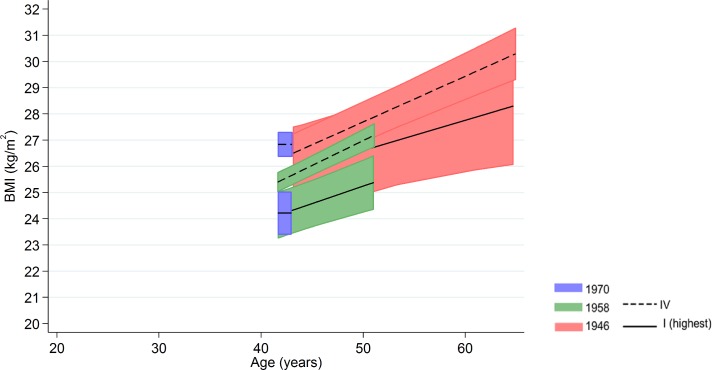
Fig 4. Female BMI across adulthood in relation to own social class (42/43 y) in the 1946 NSHD, 1958 NCDS, and 1970 BCS British birth cohort studies.
Note: lines show estimated BMI along with 95% confidence intervals at each age, estimated using multilevel general linear regression models (age terms not included in the 1970 BCS due to only one age of measurement).

