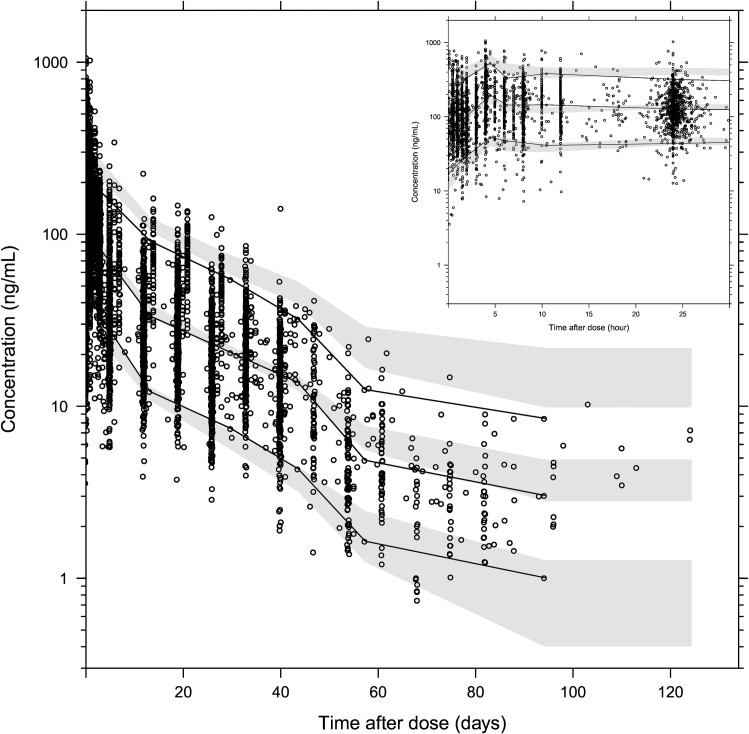
Fig 4. Prediction-corrected visual predictive check of the final population pharmacokinetic model of piperaquine.
Based on 2,000 stochastic simulations. The insert shows the first 25 h after dosing. Open circles represent the observations, and solid lines represent the 5th, 50th, and 95th percentiles of the observed data. The shaded areas represent the 95% confidence intervals around the simulated 5th, 50th, and 95th percentiles.

