
Figure 2.
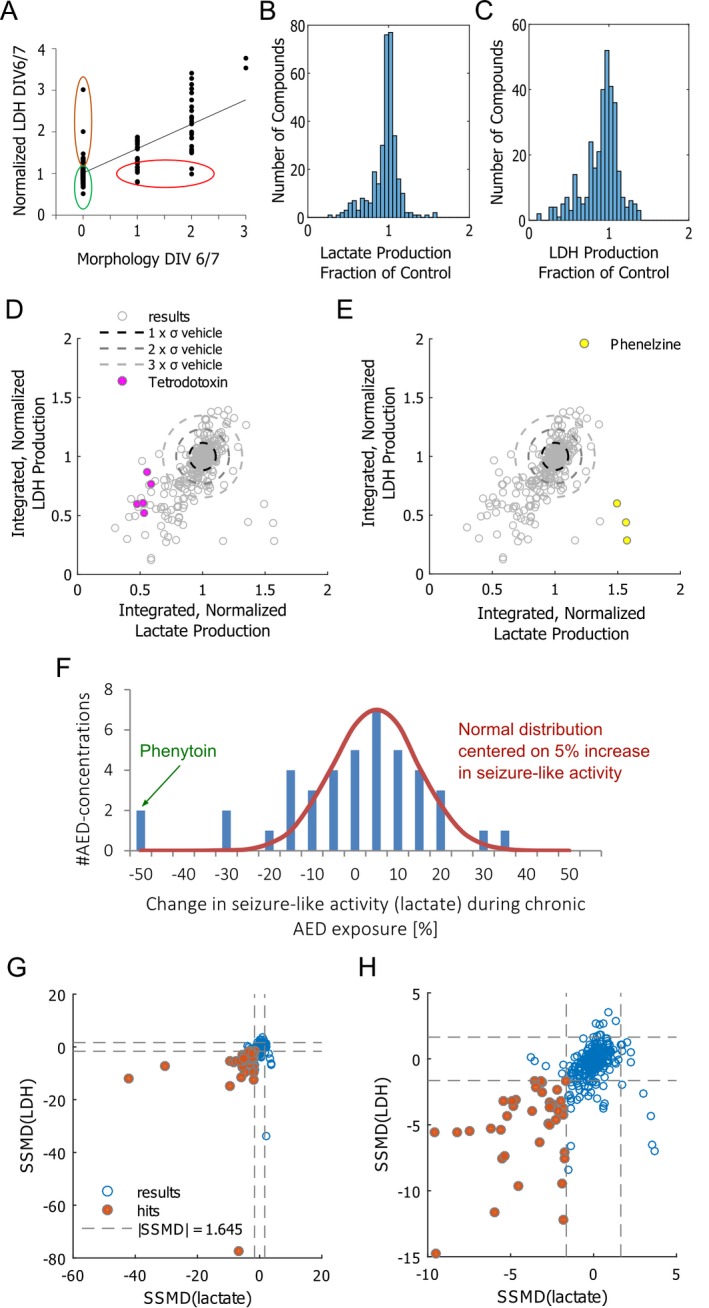
Drug effects. (A) Lactate dehydrogenase (LDH) values and morphology scores on day in vitro (DIV) 6/7 were well correlated (R2 = 0.6019, P < 0.001), suggesting that cell death led both to increased LDH release and changed culture morphology. However, in a few cases, applied compounds caused a significantly higher LDH release without accompanying change in morphology (brown outline). In other cases, differences in morphology were observed without a significant difference in LDH release (red outline). These compounds were also excluded from analysis. Compounds that were included in analysis are outlined in green. (B, C) Histograms of frequency of screened nontoxic compounds as fraction of controls for lactate production (B) and LDH release (C) (328 drug‐concentration pairs; n = 3 slices per pair). (D) Integrated lactate production (DIV 10–17), normalized to controls from the same pup versus integrated LDH production (DIV 1017), normalized to controls. σ = standard deviation of integrated lactate (horizontal axis) and LDH (vertical axis) of vehicle‐treated controls. Data are plotted for 328 drug‐concentration pairs. Effects of tetrodotoxin (D) and phenelzine (E) are highlighted for separate experiments (n = 3 each experiment) that were performed over 2–3 years to demonstrate reproducibility of the screen. (F) Histogram of effects of standard AEDs on seizure‐like activity (measured by lactate production) in organotypic hippocampal cultures. Normal distribution is included in the same plot for comparison. (G) Strictly standardized mean difference (SSMD) values of lactate and LDH production of drug‐treated cultures versus vehicle‐treated controls, evaluated between DIV 10–17. Significant results (SSMD < −1.645 for both lactate and LDH) are highlighted with brown color. (H) Same plot as (G), shown in more detail.