
Figure 4.
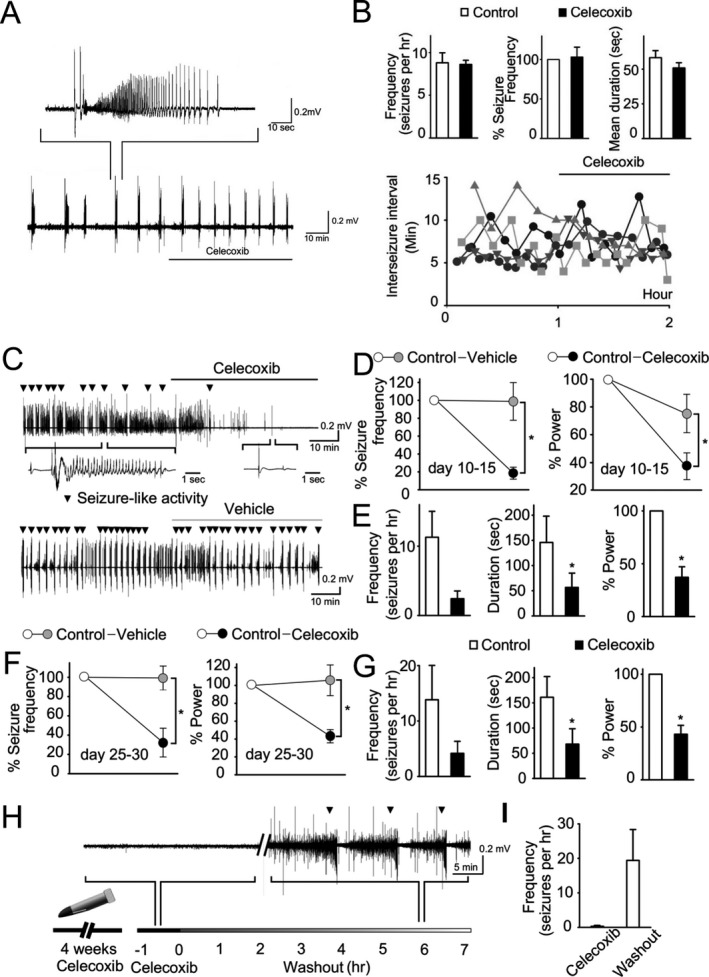
Celecoxib effects in vitro. (A) Application of celecoxib to intact hippocampal preparation in low‐Mg aCSF. A representative trace of field potential from intact hippocampal preparation treated with 10 μmol/L celecoxib with induced seizure‐like activity is shown. (B) Quantification of frequency and mean duration of seizure‐like activity showed that application of celecoxib did not alter those parameters in the intact hippocampal preparation. Different symbols and shading represent results from individual hippocampi. (C) Representative traces of field potential from organotypic hippocampal cultures treated with 10 μmol/L celecoxib or vehicle (DMSO). Inverted triangle indicates seizure‐like activity. (D, F) Frequency of seizure and power during bath application of celecoxib (black circle) or vehicle (gray circle) in younger slices (D) day in vitro (DIV 10–15; n = 8 slices per group) and older slices (F) (DIV 20–25; n = 8 for celecoxib and n = 6 for vehicle). (E, G) Comparison of frequency, total duration of seizure, and power, before and during exposure of celecoxib in younger slices (E) and older slices (G). (H, I) Hippocampal slices (n = 7) were cultured in the presence of 10 μmol/L celecoxib for 4 weeks and then washed out by artificial CSF for 7 h. Representative recording demonstrates the reappearance of seizure‐like activity after wash‐out. Error bars represent SEM, *P < 0.05 (t‐test). Statistical values were determined by one‐way analysis of variance or paired t‐test.