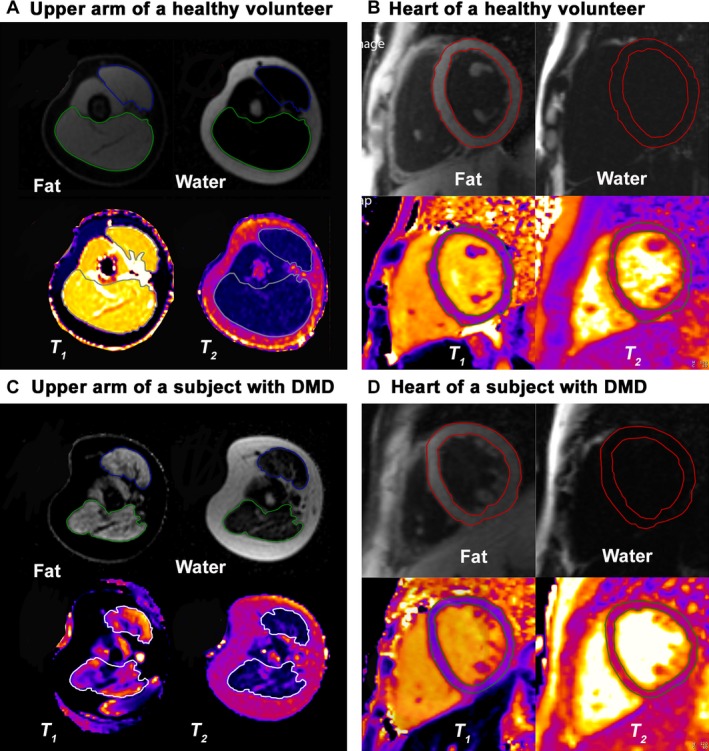
Figure 1.

Representative fat water images, and T 1‐ and T 2 ‐parametric maps of the upper arm muscles and heart in a healthy volunteer (A and B) and a subject with Duchenne muscular dystrophy (DMD) (C and D). The biceps and triceps muscles are outlined on the fat and water images with regions of interest colored blue and green, respectively, but with white regions of interest on the T 1 ‐ and T 2‐parametric maps. There is increased fat signal from both muscles in a subject with DMD (C) than in a healthy volunteer (A). The red regions of interest delineate the location of the epicardial and endocardial borders of the left ventricular myocardium on the fat and water separation images. The green regions of interest delineate the location of the epicardial and endocardial borders of the left ventricular myocardium on the T 1 and T 2 maps. There is very little fat signal from the myocardium of a subject with DMD (D), which is similar to that in a healthy volunteer (B).
