Figure 2.

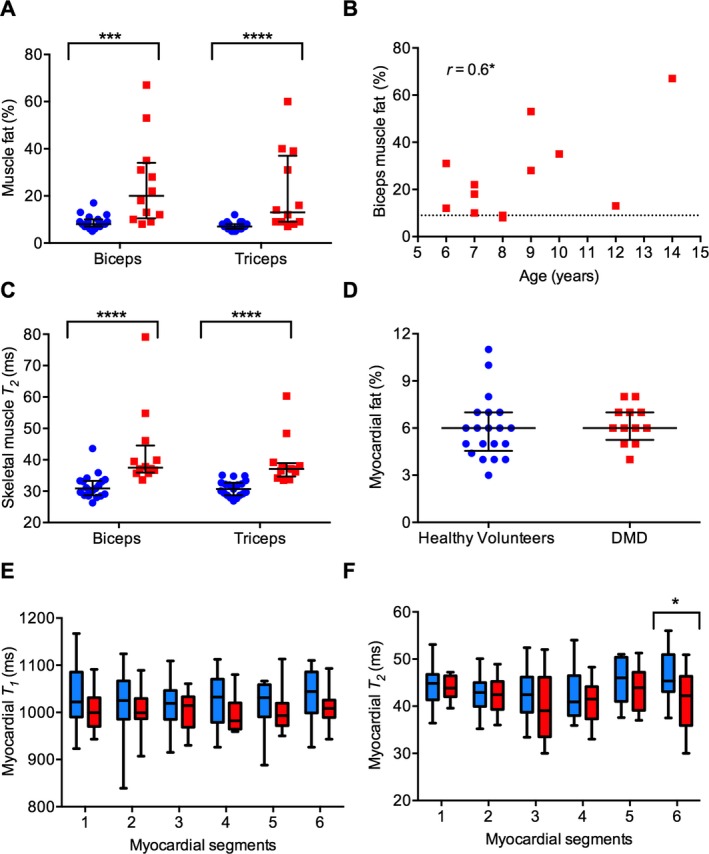
MRI quantification of muscle fat (%) and T 2 (msec) in the biceps and triceps muscles and the myocardium of the healthy volunteers (blue) and subjects with Duchenne muscular dystrophy (DMD) (red). (A) Median muscle fat (%) of the biceps and triceps muscles is significantly higher in DMD participants (n = 12) than in the healthy volunteers (n = 19). (B) Age correlation of the biceps muscle fat (%) in DMD participants. Horizontal dotted line represents the median value of the age‐range‐matched healthy volunteers. (C) Median muscle T 2 of the biceps and triceps muscles is significantly higher in DMD participants (n = 12) than in the healthy volunteers (n = 19). (D) The myocardial fat (%) in DMD participants (n = 12) is similar to the healthy volunteers (n = 20). (E) Median myocardial T 1 (msec) of DMD participants (n = 12) tended to be lower than that of the healthy volunteers (n = 18), although the difference is not statistically significant. The myocardial segments are numbered as in (F). (F) Median myocardial T 2 of the anteroseptal segment (6) is significantly lower in DMD participants (n = 10) than in the healthy volunteers (n = 16). The T 2 values in the anterior (1), anterolateral (2), inferolateral (3), inferior (4), and inferoseptal (5) myocardial segments of DMD participants are similar to that in healthy volunteers. Box and whiskers represent 5th–95th percentile values. Error bars in scatter plots represent median with interquartile range. *P < 0.05, ***P < 0.001, ****P < 0.0001. Also, see Table S1.
