
Figure 2.
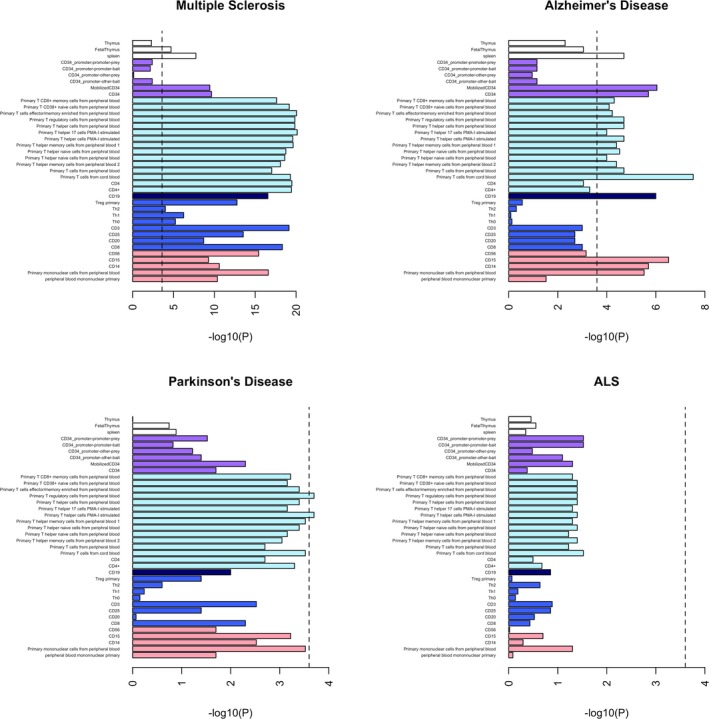
Enrichment of immune cell annotations. The black dashed lines at −log10(P) = 3.6 are the cutoff for Bonferroni significance. White bars = tissue; purple bars = CD34 (marker of immature hematopoietic cells – not strictly adaptive or innate); light blue bars = marker of T cells; dark blue bar = marker of B cells; royal blue bars = cells of the adaptive immune system; pink bars = cells of the innate immune system.