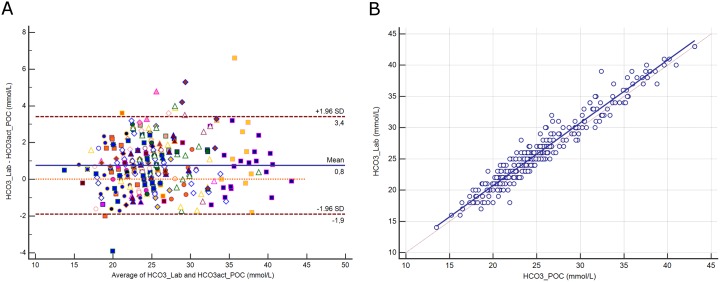
Fig 4.
4A. Bland-Altman plot showing the difference versus the average of bicarbonate (HCO3) measured by the central Lab analyzer and by the POC Siemens RAPIDPoint 500 blood gas system. Bias, upper and lower limits of agreement (±1.96 SD) are represented. The red dotted line indicates equality (difference = 0). There is one marker for each patient. 4B. Scatter diagram showing Deming regression analysis for bicarbonate (HCO3) measured by the central Lab analyzer and by the POC Siemens RAPIDPoint 500 blood gas system. The regression line (solid line) and the identity line (x = y, dotted line) are represented.

