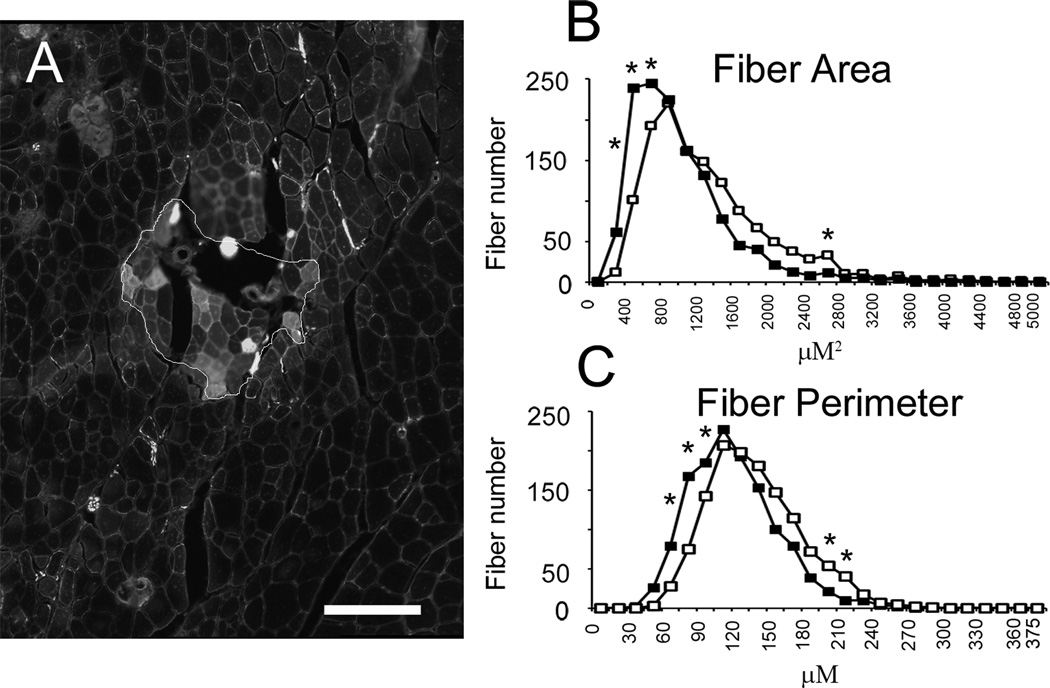
Figure 4.
GFP+ muscle fibers are smaller than GFP− muscle fibers. (A) Sample GFP+ and GFP− muscle fibers. GFP+ fibers are visible as the bright fibers within the outlined area. Muscle fiber cross-sectional area (CSA) and fiber perimeter was assessed in 1300 GFP+ and GFP− muscle fibers. Scale bar = 100 µm. (B) Frequency histogram of fiber CSA (closed squares are GFP+ fibers, open squares are GFP− fibers). Muscle fiber CSA was reduced in GFP+ fibers (889 ± 14 vs. 1107 ± 21 µm2; GFP+ vs. GFP−, two-way ANOVA, p ≤ 0.001). (C) Frequency histogram of fiber perimeter. Muscle fiber perimeter was similarly reduced in GFP+ fibers (106 ± 1 vs. 125 ± 1 µm; GFP+ vs. GFP−, two-way ANOVA, p ≤ 0.001). Asterisks indicate significant difference between GFP+ and GFP− muscle fibers at specific bin sizes.

