
Figure 1.
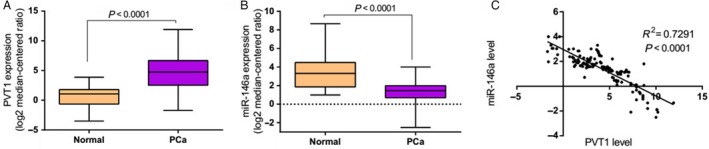
PVT1 was overexpressed in prostate cancer and negatively correlated with miR‐146a expression. (A) The expression level of PVT1 was upregulated in prostate cancer tissues. (B) The expression level of miR‐146a was downregulated in prostate cancer tissues. (C) Expression level of PVT1 was negatively correlated with miR‐146a. RNA was extracted from human prostate cancer tissue and adjacent normal tissues. The expression level of PVT1 and miR‐146a was analyzed by qRT‐PCR. GAPDH served as an internal standard. n = 152 in PCa group, n = 30 in normal group.