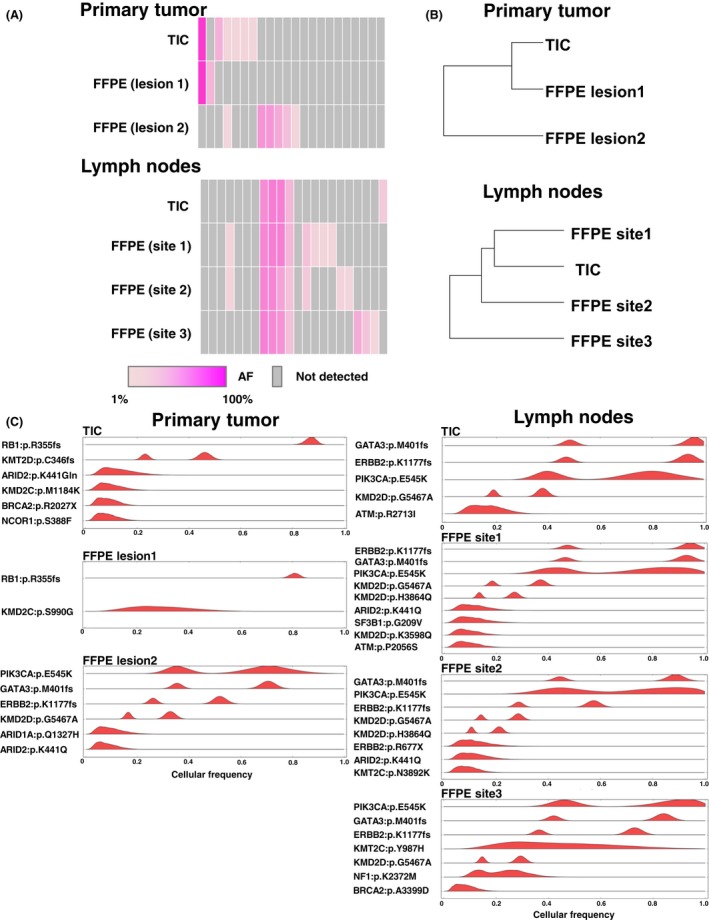
Figure 4.

TIC‐seq discriminates clonal subpopulation in multiregional tumor site. (A) Heat map showing the distribution of 43 somatic mutations for each tumor region (n = 7). Values of allelic fractions are indicated in graduation color scale from 1% (light pink) to 100% (pink). Gray columns showed no identified mutation. (B) Phylogenetic tree constructed using somatic mutational profiles of the primary tumor (n = 3) and metastatic lymph nodes (n = 4). (C) Inferred cellular frequencies for seven specimens are shown as the distribution of posterior probabilities from the PyClone model (Materials and Methods). Cellular frequency distributions are shown for each somatic mutation. TIC, touch imprint cytology.
