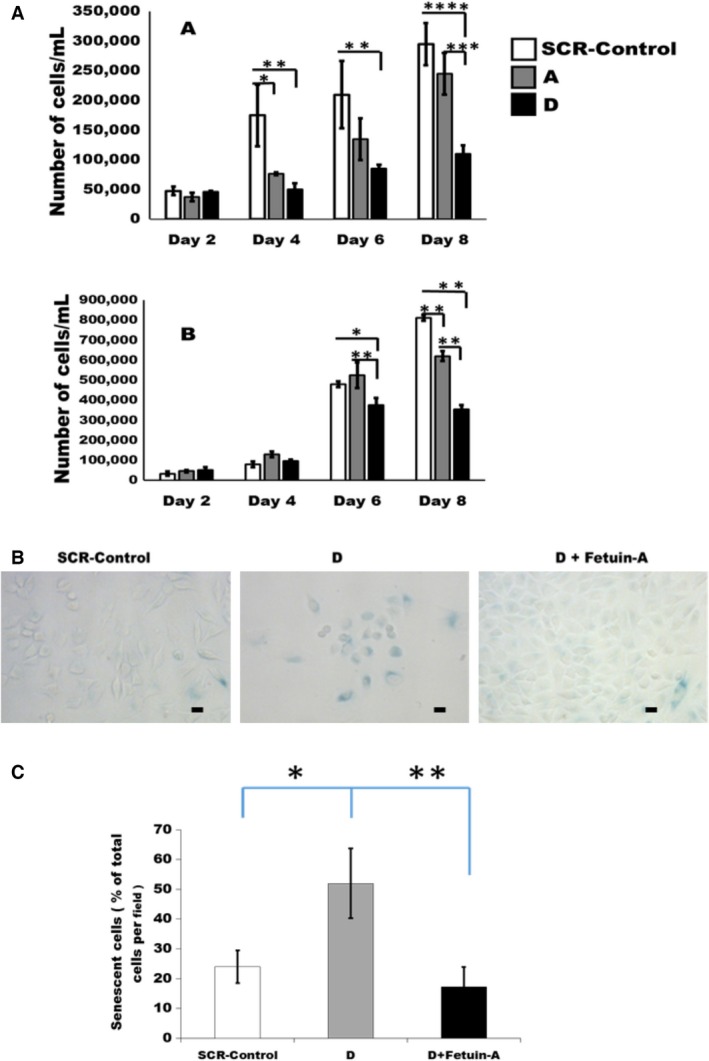
Figure 3.

Growth curves and the emergence of senescent cells in the LN229 subclones. In (A), the cells were plated in triplicates in 6‐well plates at 1 × 10⁴ cells/well in either serum‐free medium (SFM) as shown in the upper panel (*P = 0.02; **P = 0.0014; ***P = 0.005; ****P = 0.0001), or complete DMEM/F12 medium containing 5% fetal bovine serum as shown in lower panel (*P = 0.002; **P = 0.0001); then beginning at day 2 postplating, the cells were dislodged using trypsin/EDTA and counted every other day using a hemocytometer for 8 days. The bars represent mean ± SEM of three separate experiments. In (B), SCR‐Control or D subclone cells were plated in 12‐well plates at 2000 cells/well in SFM and allowed to grow for 5 days. Some of the D subclones were seeded in SFM containing purified fetal bovine serum (1 mg/mL). At the end of the growth period, the cells were fixed in fixative solution and assayed for SA‐β‐galactosidase as described in Materials and Methods. The scale bar represents 10 μm. In (C), dark blue senescent cells in panel (B) were counted in five 20× microscopic fields and expressed as average percentage of the total number of cells/20× field; 10 fields/data group. The bars represent % mean ± SEM of two separate experiments (*P = 0.01; **P = 0.005). SFM, serum‐free medium.
