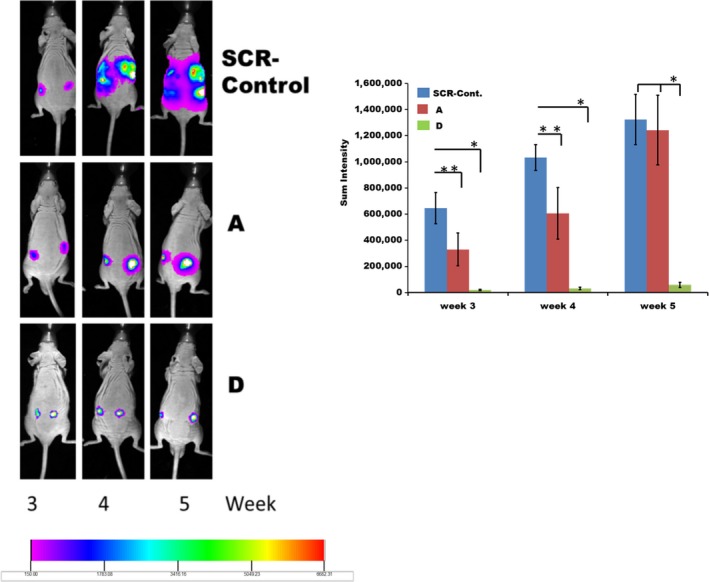
Figure 4.

The in vivo growth of LN229 and its fetuin‐A knockdown subclones (A) and (D). The cells, SCR‐Controls, clones (A) and (D) expressing firefly luciferase were injected (1 × 10⁶ cells/mouse) subcutaneously on both flanks on the dorsal surface of 6 weeks old male J:Nu mice (Jackson Laboratories). The mice in each group were imaged on weeks 3, 4, and 5 after inoculation with the cells. The tumor growth in one representative mouse from each of the three groups was followed over the 5‐week period by imaging as shown. The areas (luminescence sum intensities) of tumor spread in all the 24 mice (n = 8 per group) were carefully measured and graphed as shown. The bars represent mean tumor size by luminescence intensity per group ± SEM. *P < 0.08; **P < 0.01
