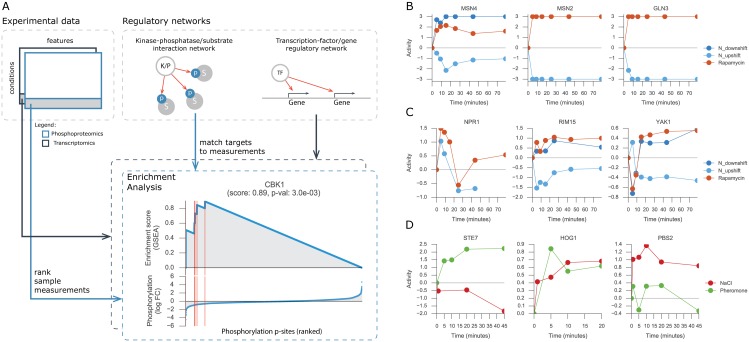
Fig 2. Protein activity analysis.
(A) Representation of the workflow used to estimate protein activities using as input an experimental data-set and a regulatory network. Regulatory network will contain either the kinase-phosphatase/substrate interactions or transcription factor/gene associations. GSEA with random permutations is used for each protein in each condition. Red vertical lines represent the targets of the protein in the ascending sorted data-set. (B, C, D) Estimated activity profile of representative proteins for each experiment used in the analysis.

