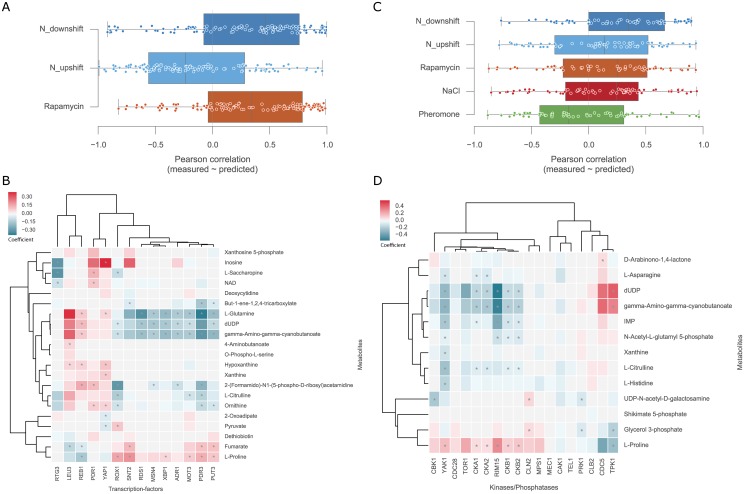
Fig 4. Overview of the putative protein-metabolite regulatory interactions.
(A) Distribution of the metabolite predicted and measured correlations using 3-fold cross-validation leaving each condition out at a time using the TFs activities scores. (B) Heatmap of the TFs-metabolites associations where values represent the averaged coefficients. (C) Correlation distributions between predicted and measured using K/P activities with 5-fold cross-validation leaving each condition out at a time. (D) Heatmap of the K/Ps-metabolites associations where values represent the averaged coefficients. Coefficients distributions are calculated using a bootstrap cross-validation randomly leaving 20% of all the samples out. This procedure is performed twenty times and the coefficients are then averaged. Asterisks (*) identify significant, FDR < 5%, Pearson correlations between the activity profiles and the metabolite fold-change across all conditions.

